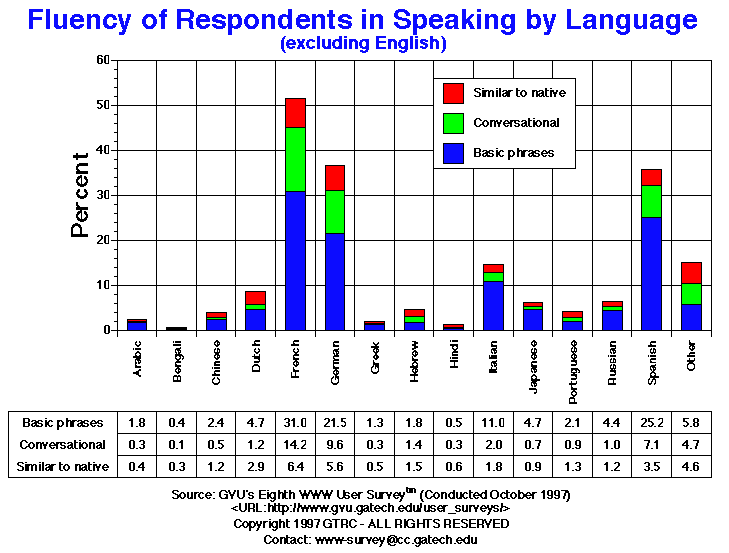

| Fluency in Speaking | Basic Phrases | Conversational | Similar to Native |
| Arabic | 1.8% | 0.3% | 0.4% |
| Bengali | 0.4% | 0.1% | 0.3% |
| Chinese | 2.4% | 0.5% | 1.2% |
| Dutch | 4.7% | 1.2% | 2.9% |
| English | 0.7% | 16.6% | 63.0% |
| French | 31.0% | 14.2% | 6.4% |
| German | 21.5% | 9.6% | 5.6% |
| Greek | 1.3% | 0.3% | 0.5% |
| Hebrew | 1.8% | 1.4% | 1.5% |
| Hindi | 0.5% | 0.3% | 0.6% |
| Italian | 11.0% | 2.0% | 1.8% |
| Japanese | 4.7% | 0.7% | 0.9% |
| Portuguese | 2.1% | 0.9% | 1.3% |
| Russian | 4.4% | 1.0% | 1.2% |
| Spanish | 25.2% | 7.1% | 3.5% |
| Other | 5.8% | 4.7% | 4.6% |

GVU's WWW Surveying Team
Graphics, Visualization, & Usability Center
College of Computing
Georgia Institute of Technology
Atlanta, GA 30332-0280