
| Community Building | All | Male | Female | USA | Europe | 10-18 | 19-25 | 26-50 | 50+ | Novice | Intermediate | Expert |
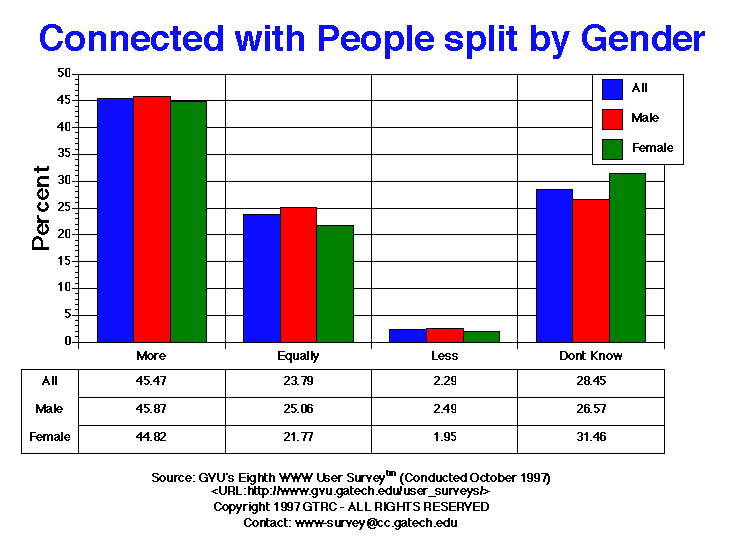
| Less | 231.00 2.29% |
155.00 2.49% |
76.00 1.95% |
197.00 2.31% |
8.00 1.19% |
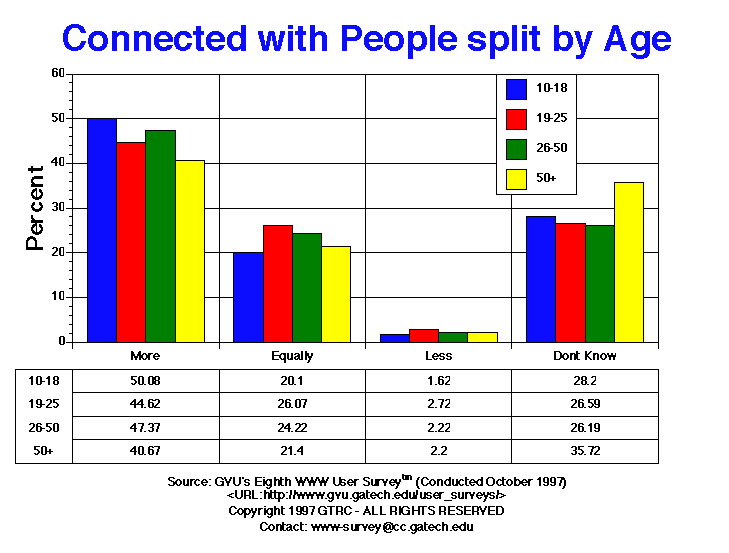
10.00 1.62% |
52.00 2.72% |
127.00 2.22% |
32.00 2.20% |
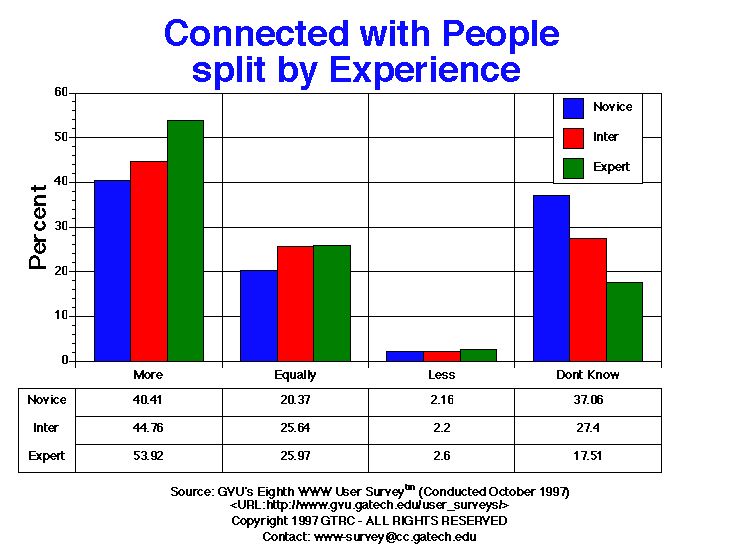
80.00 2.16% |
85.00 2.20% |
66.00 2.60% |
| Equally | 2405.00 23.79% |
1558.00 25.06% |
847.00 21.77% |
1978.00 23.24% |
211.00 31.31% |
124.00 20.10% |
499.00 26.07% |
1385.00 24.22% |
311.00 21.40% |
754.00 20.37% |
991.00 25.64% |
660.00 25.97% |
| More | 4596.00 45.47% |
2852.00 45.87% |
1744.00 44.82% |
3847.00 45.21% |
338.00 50.15% |
309.00 50.08% |
854.00 44.62% |
2709.00 47.37% |
591.00 40.67% |
1496.00 40.41% |
1730.00 44.76% |
1370.00 53.92% |
| Dont Know | 2876.00 28.45% |
1652.00 26.57% |
1224.00 31.46% |
2488.00 29.24% |
117.00 17.36% |
174.00 28.20% |
509.00 26.59% |
1498.00 26.19% |
519.00 35.72% |
1372.00 37.06% |
1059.00 27.40% |
445.00 17.51% |


GVU's WWW Surveying Team
Graphics, Visualization, & Usability Center
College of Computing
Georgia Institute of Technology
Atlanta, GA 30332-0280