
| Disability | All | Male | Female | USA | Europe | 10-18 | 19-25 | 26-50 | 50+ | Novice | Intermediate | Expert |
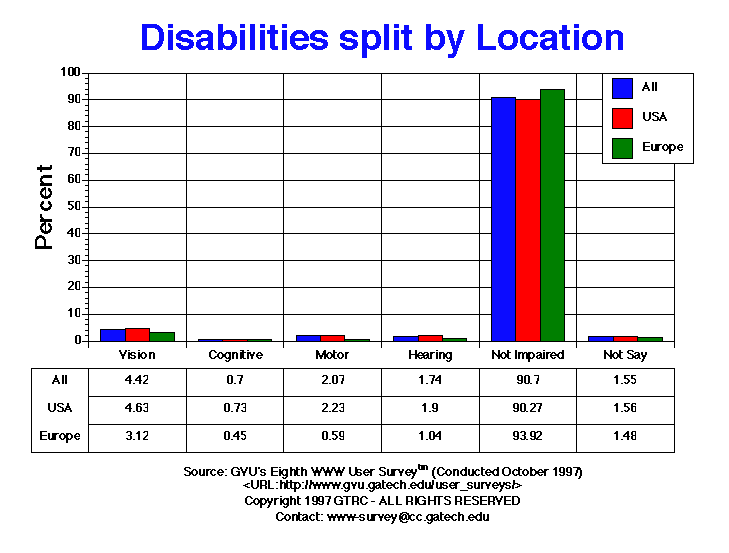
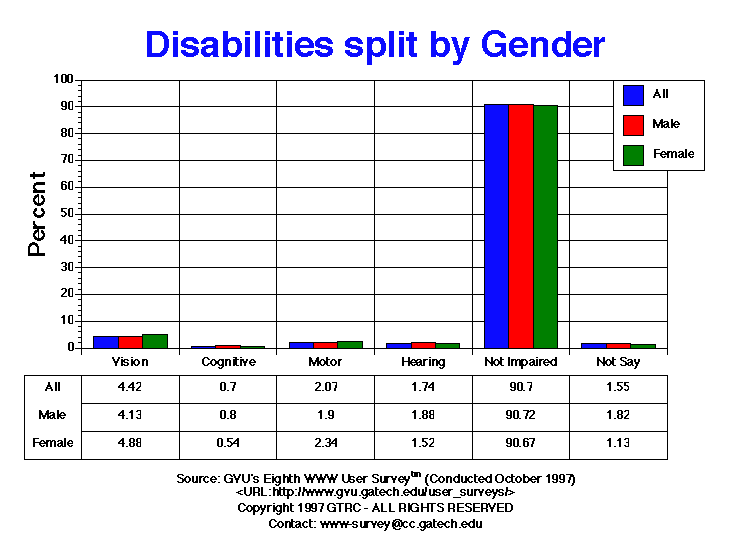
| Cognitive | 71.00 0.70% |
50.00 0.80% |
21.00 0.54% |
62.00 0.73% |
3.00 0.45% |
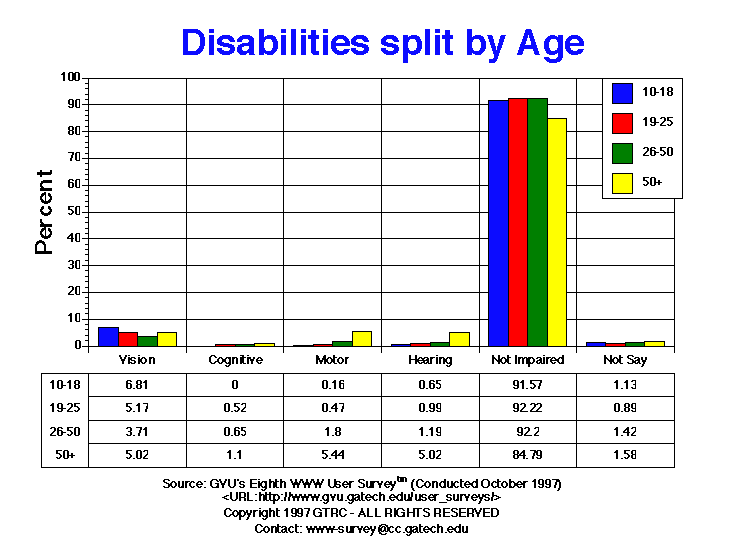
0.00 0.00% |
10.00 0.52% |
37.00 0.65% |
16.00 1.10% |
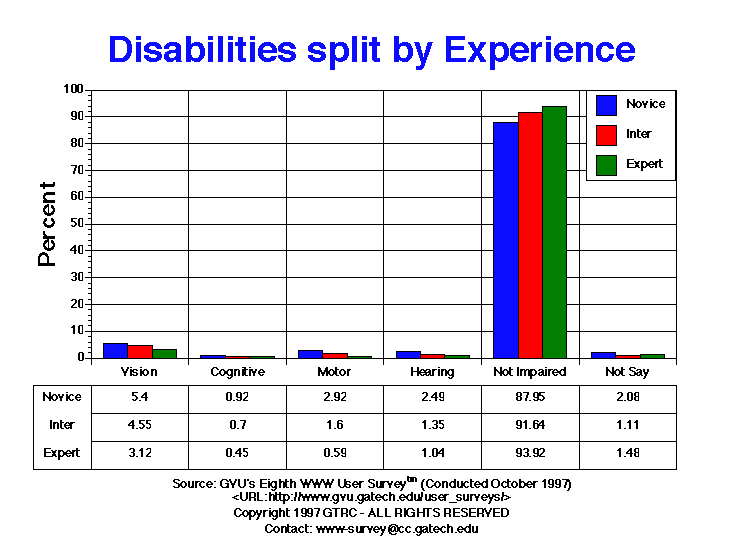
34.00 0.92% |
27.00 0.70% |
3.00 0.45% |
| Hearing | 176.00 1.74% |
117.00 1.88% |
59.00 1.52% |
162.00 1.90% |
7.00 1.04% |
4.00 0.65% |
19.00 0.99% |
68.00 1.19% |
73.00 5.02% |
92.00 2.49% |
52.00 1.35% |
7.00 1.04% |
| Motor | 209.00 2.07% |
118.00 1.90% |
91.00 2.34% |
190.00 2.23% |
4.00 0.59% |
1.00 0.16% |
9.00 0.47% |
103.00 1.80% |
79.00 5.44% |
108.00 2.92% |
62.00 1.60% |
4.00 0.59% |
| Vision | 447.00 4.42% |
257.00 4.13% |
190.00 4.88% |
394.00 4.63% |
21.00 3.12% |
42.00 6.81% |
99.00 5.17% |
212.00 3.71% |
73.00 5.02% |
200.00 5.40% |
176.00 4.55% |
21.00 3.12% |
| Not Impaired | 9168.00 90.70% |
5640.00 90.72% |
3528.00 90.67% |
7682.00 90.27% |
633.00 93.92% |
565.00 91.57% |
1765.00 92.22% |
5273.00 92.20% |
1232.00 84.79% |
3256.00 87.95% |
3542.00 91.64% |
633.00 93.92% |
| Not Say | 157.00 1.55% |
113.00 1.82% |
44.00 1.13% |
133.00 1.56% |
10.00 1.48% |
7.00 1.13% |
17.00 0.89% |
81.00 1.42% |
23.00 1.58% |
77.00 2.08% |
43.00 1.11% |
10.00 1.48% |


GVU's WWW Surveying Team
Graphics, Visualization, & Usability Center
College of Computing
Georgia Institute of Technology
Atlanta, GA 30332-0280