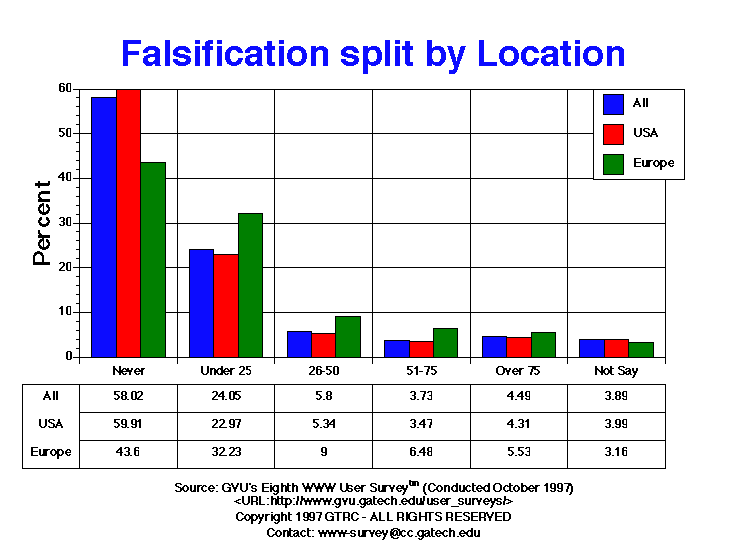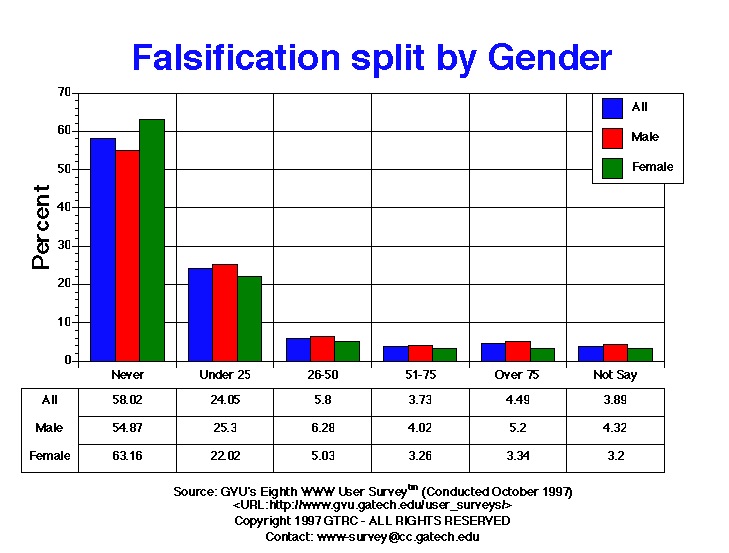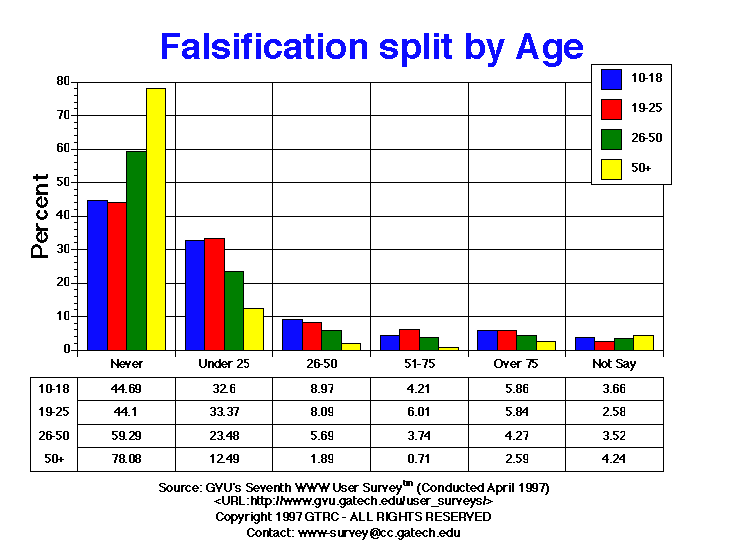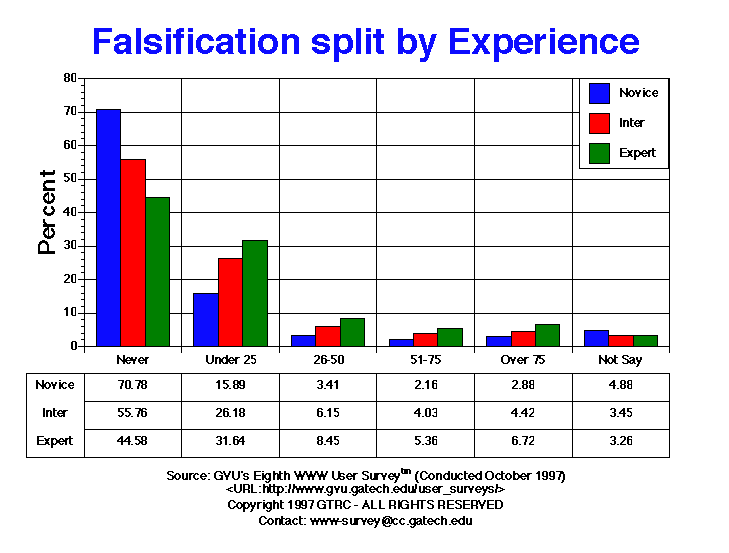

| Falsification of Information | All | Male | Female | USA | Europe | 10-18 | 19-25 | 26-50 | 50+ | Novice | Intermediate | Expert |
| Never | 5348.00 58.02% |
3136.00 54.87% |
2212.00 63.16% |
4641.00 59.91% |
276.00 43.60% |
244.00 44.69% |
785.00 44.10% |
3136.00 59.29% |
994.00 78.08% |
2262.00 70.78% |
2004.00 55.76% |
1082.00 44.58% |
| Under 25% | 2217.00 24.05% |
1446.00 25.30% |
771.00 22.02% |
1779.00 22.97% |
204.00 32.23% |
178.00 32.60% |
594.00 33.37% |
1242.00 23.48% |
159.00 12.49% |
508.00 15.89% |
941.00 26.18% |
768.00 31.64% |
| 26%-50% | 535.00 5.80% |
359.00 6.28% |
176.00 5.03% |
414.00 5.34% |
57.00 9.00% |
49.00 8.97% |
144.00 8.09% |
301.00 5.69% |
24.00 1.89% |
109.00 3.41% |
221.00 6.15% |
205.00 8.45% |
| 51%-75% | 344.00 3.73% |
230.00 4.02% |
114.00 3.26% |
269.00 3.47% |
41.00 6.48% |
23.00 4.21% |
107.00 6.01% |
198.00 3.74% |
9.00 0.71% |
69.00 2.16% |
145.00 4.03% |
130.00 5.36% |
| Over 75% | 414.00 4.49% |
297.00 5.20% |
117.00 3.34% |
334.00 4.31% |
35.00 5.53% |
32.00 5.86% |
104.00 5.84% |
226.00 4.27% |
33.00 2.59% |
92.00 2.88% |
159.00 4.42% |
163.00 6.72% |
| Not Say | 359.00 3.89% |
247.00 4.32% |
112.00 3.20% |
309.00 3.99% |
20.00 3.16% |
20.00 3.66% |
46.00 2.58% |
186.00 3.52% |
54.00 4.24% |
156.00 4.88% |
124.00 3.45% |
79.00 3.26% |


GVU's WWW Surveying Team
Graphics, Visualization, & Usability Center
College of Computing
Georgia Institute of Technology
Atlanta, GA 30332-0280