
| Household Income (x 1000) |
All | Male | Female | USA | Europe | 10-18 | 19-25 | 26-50 | 50+ | Novice | Intermediate | Expert |
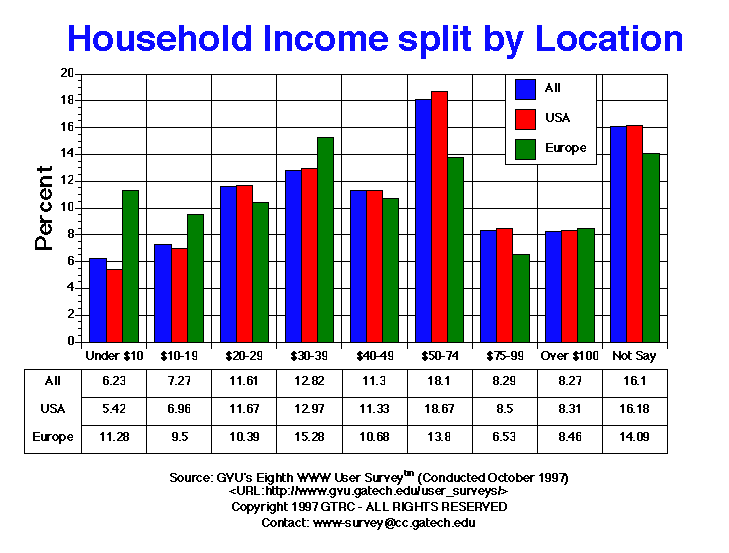
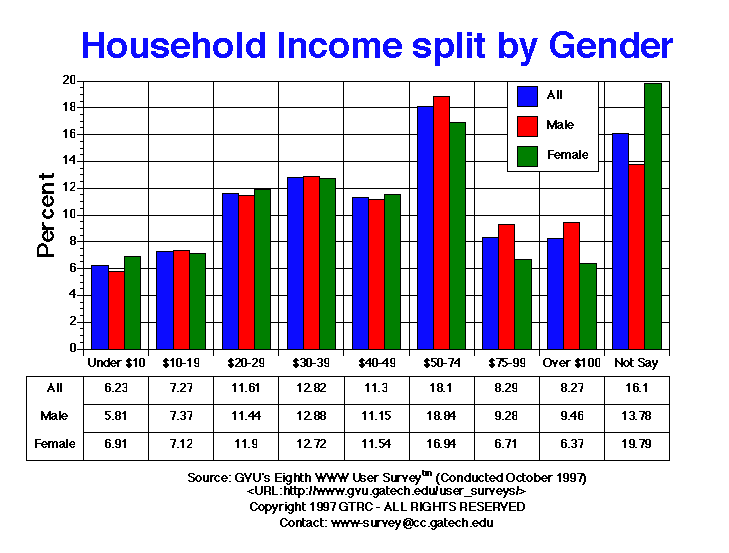
| Under $10 | 630.00 6.23% |
361.00 5.81% |
269.00 6.91% |
461.00 5.42% |
76.00 11.28% |
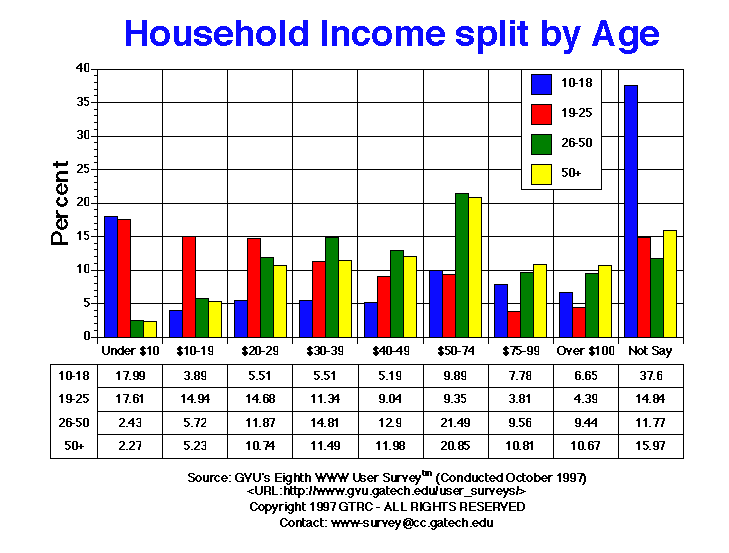
111.00 17.99% |
337.00 17.61% |
139.00 2.43% |
33.00 2.27% |
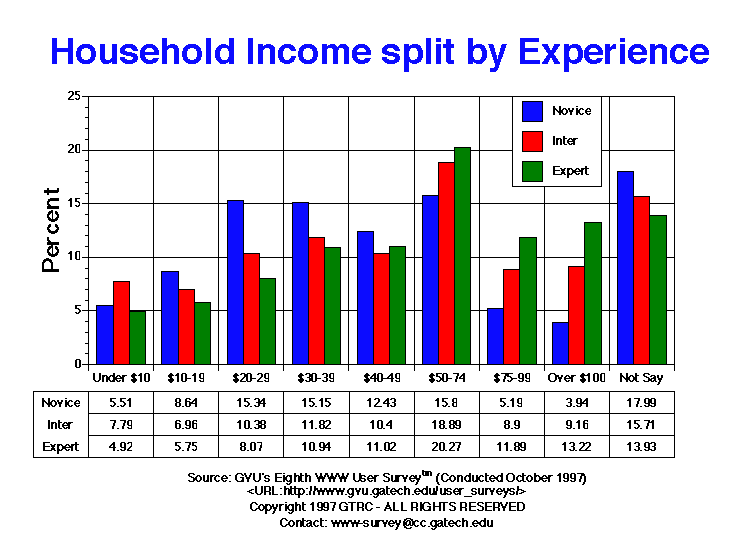
204.00 5.51% |
301.00 7.79% |
125.00 4.92% |
| $10-19 | 735.00 7.27% |
458.00 7.37% |
277.00 7.12% |
592.00 6.96% |
64.00 9.50% |
24.00 3.89% |
286.00 14.94% |
327.00 5.72% |
76.00 5.23% |
320.00 8.64% |
269.00 6.96% |
146.00 5.75% |
| $20-29 | 1174.00 11.61% |
711.00 11.44% |
463.00 11.90% |
993.00 11.67% |
70.00 10.39% |
34.00 5.51% |
281.00 14.68% |
679.00 11.87% |
156.00 10.74% |
568.00 15.34% |
401.00 10.38% |
205.00 8.07% |
| $30-39 | 1296.00 12.82% |
801.00 12.88% |
495.00 12.72% |
1104.00 12.97% |
103.00 15.28% |
34.00 5.51% |
217.00 11.34% |
847.00 14.81% |
167.00 11.49% |
561.00 15.15% |
457.00 11.82% |
278.00 10.94% |
| $40-49 | 1142.00 11.30% |
693.00 11.15% |
449.00 11.54% |
964.00 11.33% |
72.00 10.68% |
32.00 5.19% |
173.00 9.04% |
738.00 12.90% |
174.00 11.98% |
460.00 12.43% |
402.00 10.40% |
280.00 11.02% |
| $50-74 | 1830.00 18.10% |
1171.00 18.84% |
659.00 16.94% |
1589.00 18.67% |
93.00 13.80% |
61.00 9.89% |
179.00 9.35% |
1229.00 21.49% |
303.00 20.85% |
585.00 15.80% |
730.00 18.89% |
515.00 20.27% |
| $75-99 | 838.00 8.29% |
577.00 9.28% |
261.00 6.71% |
723.00 8.50% |
44.00 6.53% |
48.00 7.78% |
73.00 3.81% |
547.00 9.56% |
157.00 10.81% |
192.00 5.19% |
344.00 8.90% |
302.00 11.89% |
| Over $100 | 836.00 8.27% |
588.00 9.46% |
248.00 6.37% |
707.00 8.31% |
57.00 8.46% |
41.00 6.65% |
84.00 4.39% |
540.00 9.44% |
155.00 10.67% |
146.00 3.94% |
354.00 9.16% |
336.00 13.22% |
| Not Say | 1627.00 16.10% |
857.00 13.78% |
770.00 19.79% |
1377.00 16.18% |
95.00 14.09% |
232.00 37.60% |
284.00 14.84% |
673.00 11.77% |
232.00 15.97% |
666.00 17.99% |
607.00 15.71% |
354.00 13.93% |
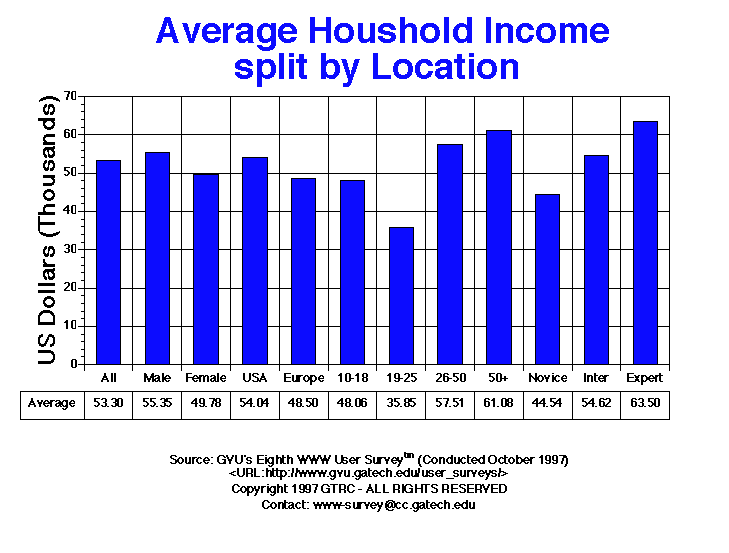
| Average Household Income (x1000 USD) | |
| All | 53.30 |
| Male | 55.35 |
| Female | 49.78 |
| USA | 54.04 |
| Europe | 48.50 |
| 10-18 | 48.06 |
| 19-25 | 35.85 |
| 26-50 | 57.51 |
| 50+ | 61.08 |
| Novice | 44.54 |
| Intermediate | 54.62 |
| Expert | 63.50 |
GVU's WWW Surveying Team
Graphics, Visualization, & Usability Center
College of Computing
Georgia Institute of Technology
Atlanta, GA 30332-0280