
| Major Occupation | All | Male | Female | USA | Europe | 10-18 | 19-25 | 26-50 | 50+ | Novice | Intermediate | Expert |
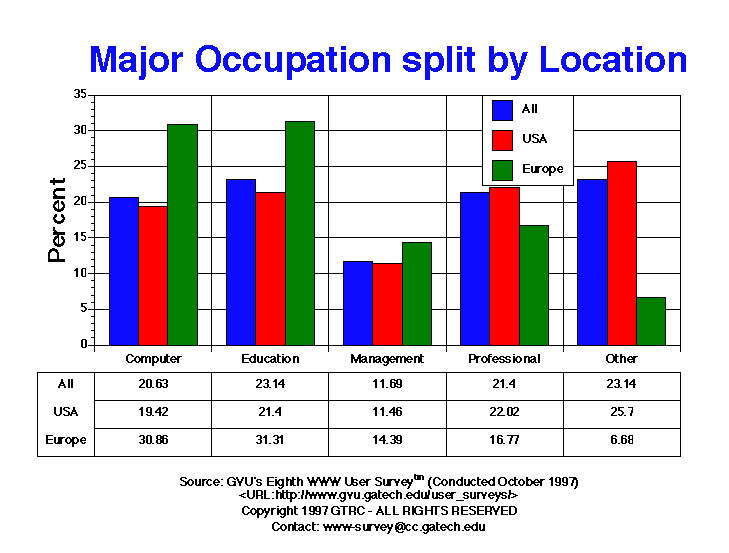
| Computer | 2085.00 20.63% |
1432.00 23.03% |
653.00 16.78% |
1653.00 19.42% |
208.00 30.86% |
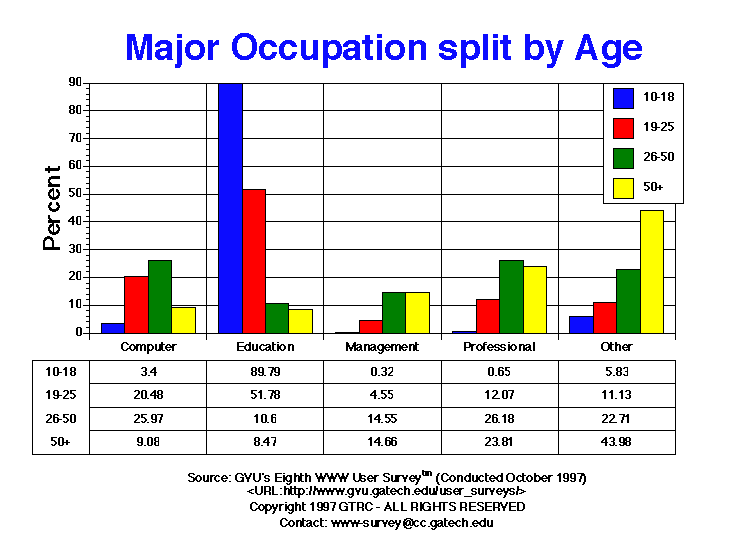
21.00 3.40% |
392.00 20.48% |
1485.00 25.97% |
132.00 9.08% |
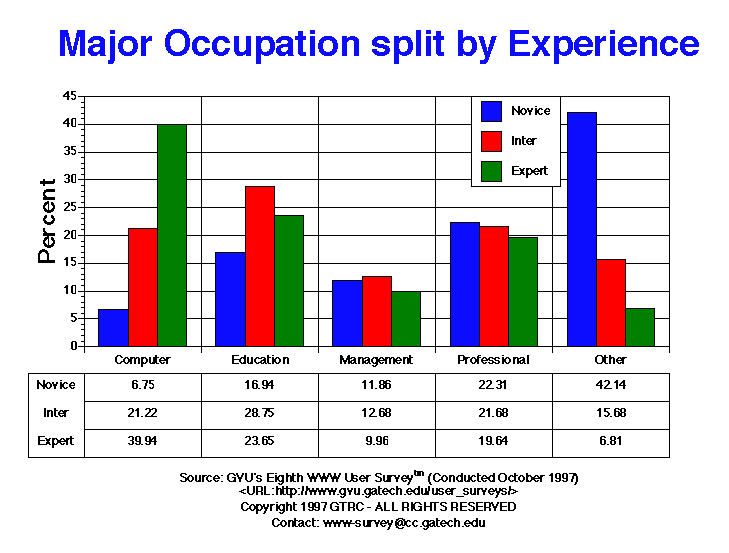
250.00 6.75% |
820.00 21.22% |
1015.00 39.94% |
| Education | 2339.00 23.14% |
1308.00 21.04% |
1031.00 26.50% |
1821.00 21.40% |
211.00 31.31% |
554.00 89.79% |
991.00 51.78% |
606.00 10.60% |
123.00 8.47% |
627.00 16.94% |
1111.00 28.75% |
601.00 23.65% |
| Management | 1182.00 11.69% |
828.00 13.32% |
354.00 9.10% |
975.00 11.46% |
97.00 14.39% |
2.00 0.32% |
87.00 4.55% |
832.00 14.55% |
213.00 14.66% |
439.00 11.86% |
490.00 12.68% |
253.00 9.96% |
| Professional | 2163.00 21.40% |
1352.00 21.75% |
811.00 20.84% |
1874.00 22.02% |
113.00 16.77% |
4.00 0.65% |
231.00 12.07% |
1497.00 26.18% |
346.00 23.81% |
826.00 22.31% |
838.00 21.68% |
499.00 19.64% |
| Other | 2339.00 23.14% |
1297.00 20.86% |
1042.00 26.78% |
2187.00 25.70% |
45.00 6.68% |
36.00 5.83% |
213.00 11.13% |
1299.00 22.71% |
639.00 43.98% |
1560.00 42.14% |
606.00 15.68% |
173.00 6.81% |


GVU's WWW Surveying Team
Graphics, Visualization, & Usability Center
College of Computing
Georgia Institute of Technology
Atlanta, GA 30332-0280