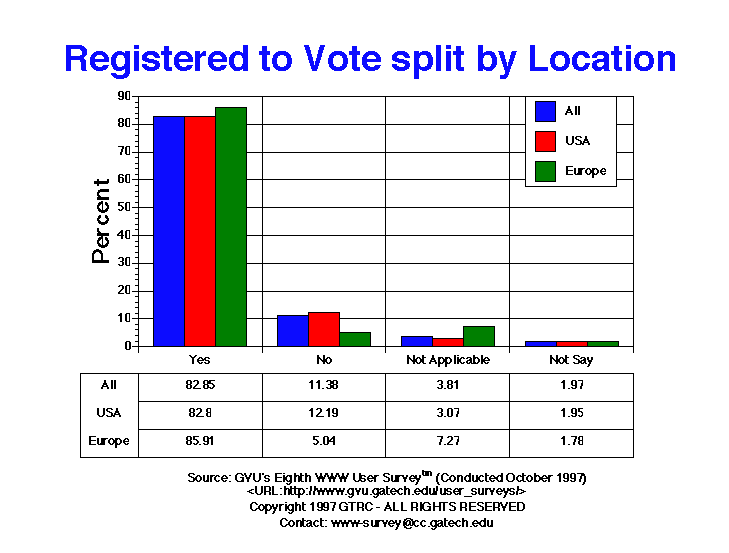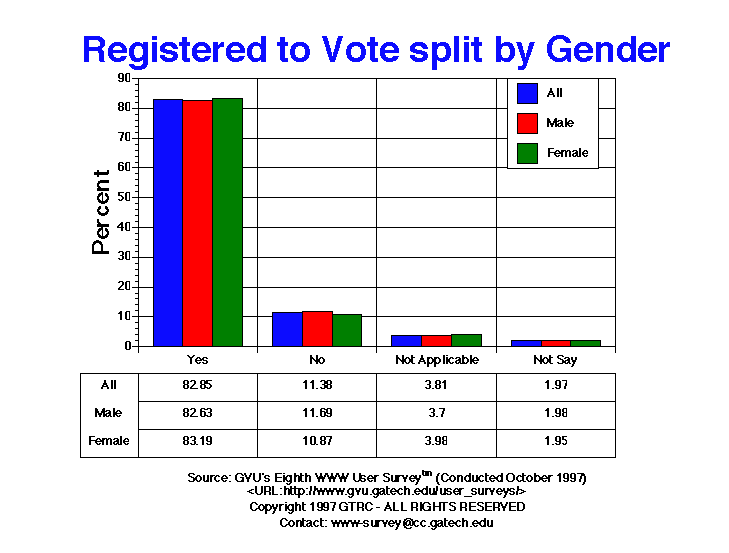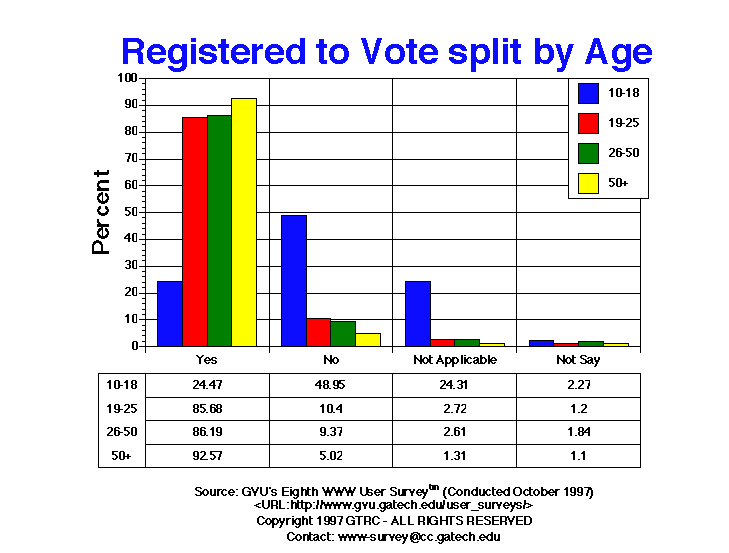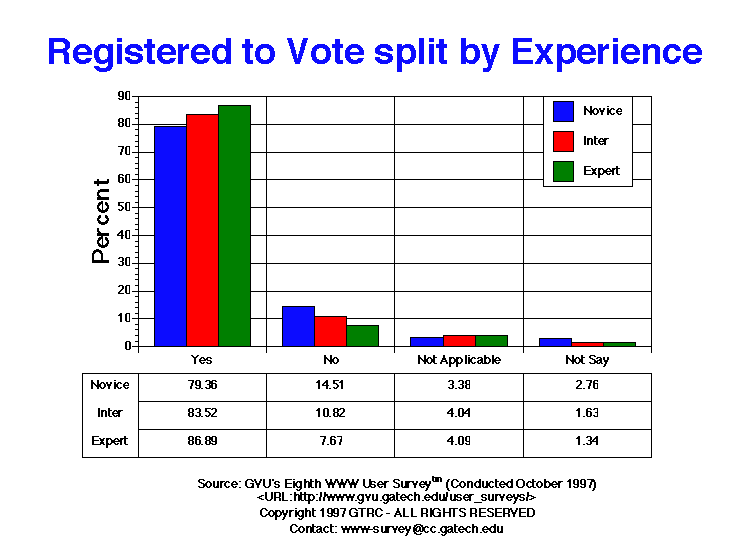

| Registered to Vote | All | Male | Female | USA | Europe | 10-18 | 19-25 | 26-50 | 50+ | Novice | Intermediate | Expert |
| No | 1150.00 11.38% |
727.00 11.69% |
423.00 10.87% |
1037.00 12.19% |
34.00 5.04% |
302.00 48.95% |
199.00 10.40% |
536.00 9.37% |
73.00 5.02% |
537.00 14.51% |
418.00 10.82% |
195.00 7.67% |
| Yes | 8374.00 82.85% |
5137.00 82.63% |
3237.00 83.19% |
7046.00 82.80% |
579.00 85.91% |
151.00 24.47% |
1640.00 85.68% |
4929.00 86.19% |
1345.00 92.57% |
2938.00 79.36% |
3228.00 83.52% |
2208.00 86.89% |
| Not Applicable | 385.00 3.81% |
230.00 3.70% |
155.00 3.98% |
261.00 3.07% |
49.00 7.27% |
150.00 24.31% |
52.00 2.72% |
149.00 2.61% |
19.00 1.31% |
125.00 3.38% |
156.00 4.04% |
104.00 4.09% |
| Not Say | 199.00 1.97% |
123.00 1.98% |
76.00 1.95% |
166.00 1.95% |
12.00 1.78% |
14.00 2.27% |
23.00 1.20% |
105.00 1.84% |
16.00 1.10% |
102.00 2.76% |
63.00 1.63% |
34.00 1.34% |


GVU's WWW Surveying Team
Graphics, Visualization, & Usability Center
College of Computing
Georgia Institute of Technology
Atlanta, GA 30332-0280