
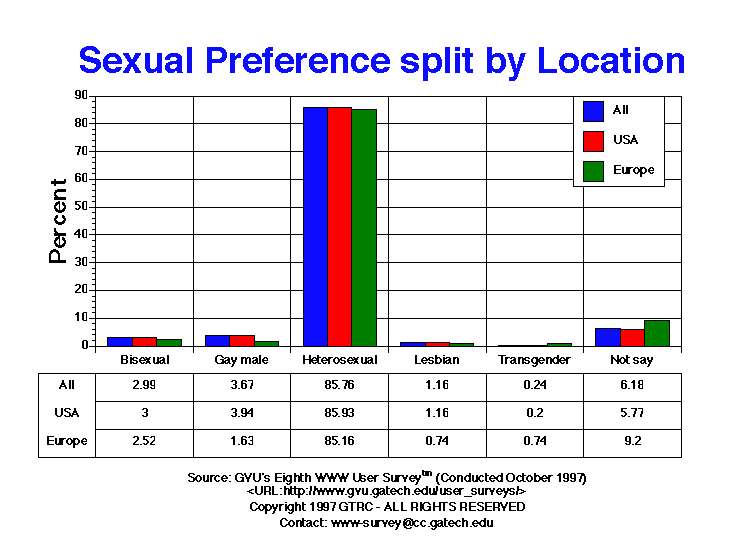
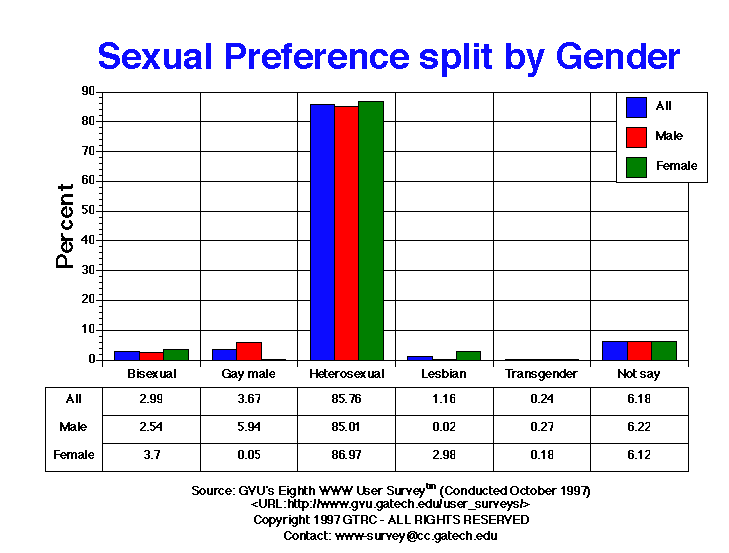
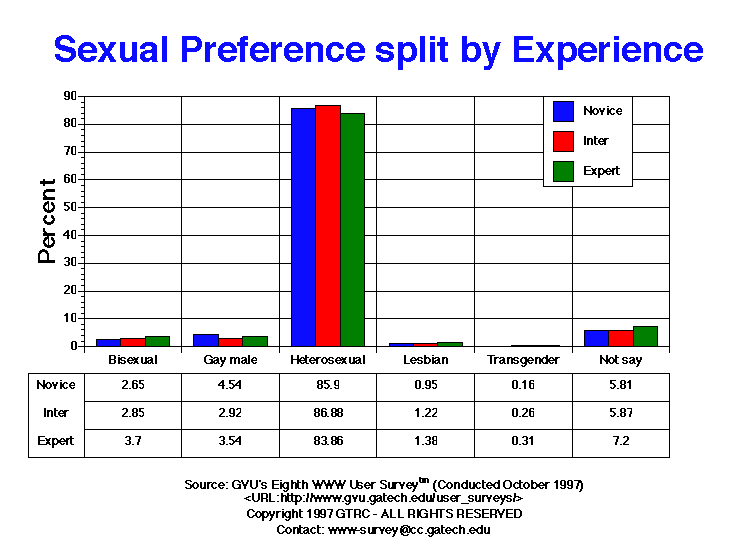
| Sexual Preference | All | Male | Female | USA | Europe | 10-18 | 19-25 | 26-50 | 50+ | Novice | Intermediate | Expert |
| Bisexual | 302.00 2.99% |
158.00 2.54% |
144.00 3.70% |
255.00 3.00% |
17.00 2.52% |
19.00 3.08% |
88.00 4.60% |
161.00 2.82% |
25.00 1.72% |
98.00 2.65% |
110.00 2.85% |
94.00 3.70% |
| Gay male | 371.00 3.67% |
369.00 5.94% |
2.00 0.05% |
335.00 3.94% |
11.00 1.63% |
6.00 0.97% |
52.00 2.72% |
255.00 4.46% |
47.00 3.23% |
168.00 4.54% |
113.00 2.92% |
90.00 3.54% |
| Heterosexual | 8669.00 85.76% |
5285.00 85.01% |
3384.00 86.97% |
7313.00 85.93% |
574.00 85.16% |
551.00 89.30% |
1686.00 88.09% |
4870.00 85.15% |
1274.00 87.68% |
3180.00 85.90% |
3358.00 86.88% |
2131.00 83.86% |
| Lesbian | 117.00 1.16% |
1.00 0.02% |
116.00 2.98% |
99.00 1.16% |
5.00 0.74% |
2.00 0.32% |
13.00 0.68% |
88.00 1.54% |
13.00 0.89% |
35.00 0.95% |
47.00 1.22% |
35.00 1.38% |
| Transgender | 24.00 0.24% |
17.00 0.27% |
7.00 0.18% |
17.00 0.20% |
5.00 0.74% |
1.00 0.16% |
6.00 0.31% |
12.00 0.21% |
5.00 0.34% |
6.00 0.16% |
10.00 0.26% |
8.00 0.31% |
| Not say | 625.00 6.18% |
387.00 6.22% |
238.00 6.12% |
491.00 5.77% |
62.00 9.20% |
38.00 6.16% |
69.00 3.61% |
333.00 5.82% |
89.00 6.13% |
215.00 5.81% |
227.00 5.87% |
183.00 7.20% |

GVU's WWW Surveying Team
Graphics, Visualization, & Usability Center
College of Computing
Georgia Institute of Technology
Atlanta, GA 30332-0280