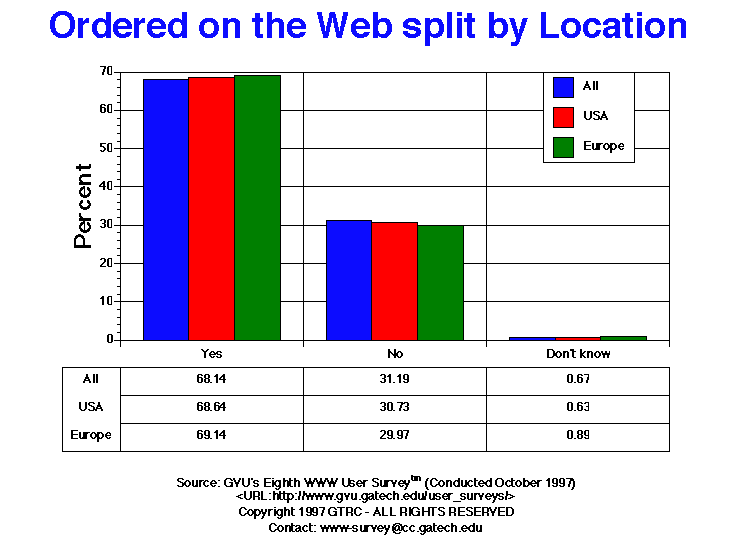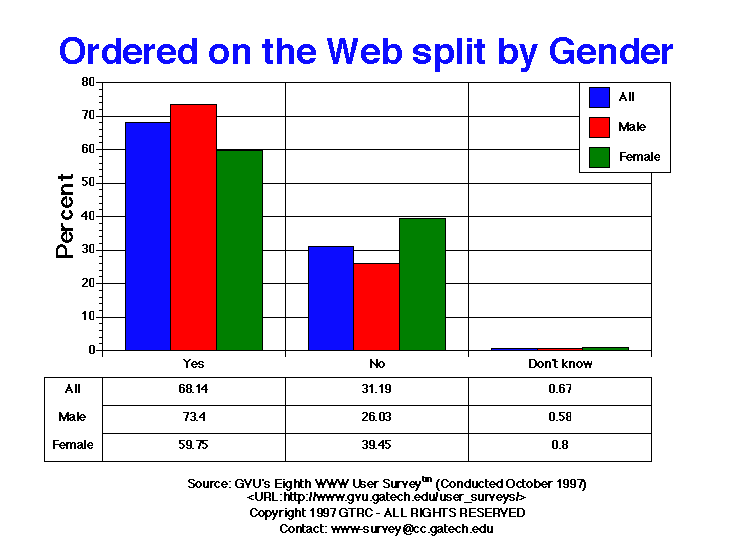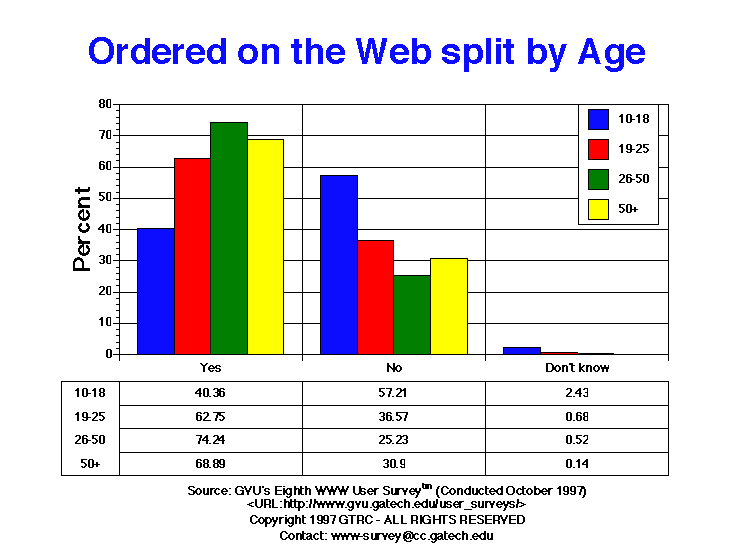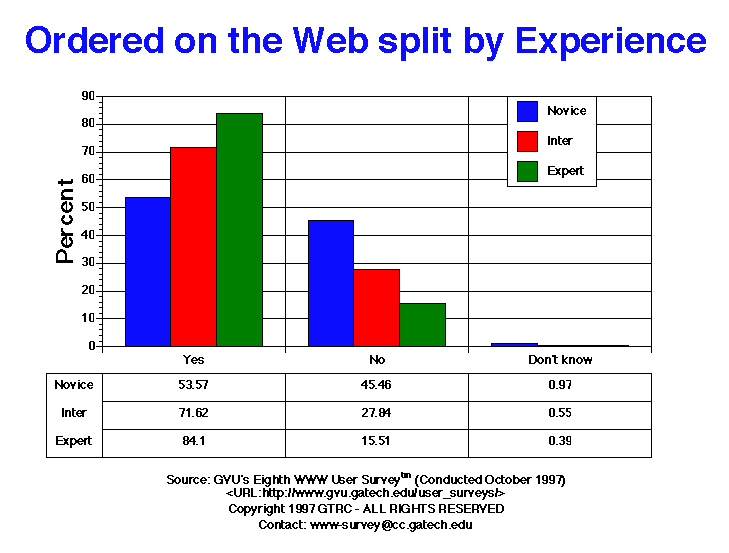

| Web Ordering | All | Male | Female | USA | Europe | 10-18 | 19-25 | 26-50 | 50+ | Novice | Intermediate | Expert |
| No | 3153.00 31.19% |
1618.00 26.03% |
1535.00 39.45% |
2615.00 30.73% |
202.00 29.97% |
353.00 57.21% |
700.00 36.57% |
1443.00 25.23% |
449.00 30.90% |
1683.00 45.46% |
1076.00 27.84% |
394.00 15.51% |
| Yes | 6888.00 68.14% |
4563.00 73.40% |
2325.00 59.75% |
5841.00 68.64% |
466.00 69.14% |
249.00 40.36% |
1201.00 62.75% |
4246.00 74.24% |
1001.00 68.89% |
1983.00 53.57% |
2768.00 71.62% |
2137.00 84.10% |
| Don't know | 67.00 0.68% |
36.00 0.58% |
31.00 0.80% |
54.00 0.63% |
6.00 0.89% |
15.00 2.43% |
13.00 0.68% |
30.00 0.52% |
3.00 0.21% |
36.00 0.97% |
21.00 0.55% |
10.00 0.39% |


GVU's WWW Surveying Team
Graphics, Visualization, & Usability Center
College of Computing
Georgia Institute of Technology
Atlanta, GA 30332-0280