
| Who Pays for Access | All | Male | Female | USA | Europe | 10-18 | 19-25 | 26-50 | 50+ | Novice | Intermediate | Expert |
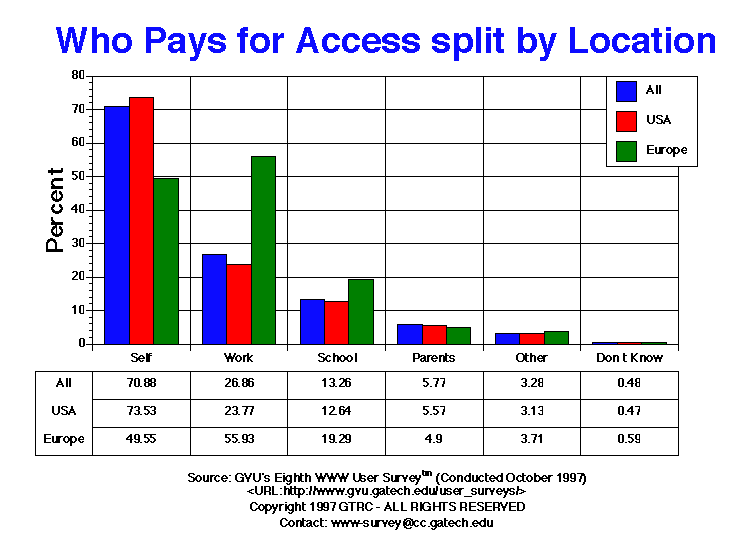
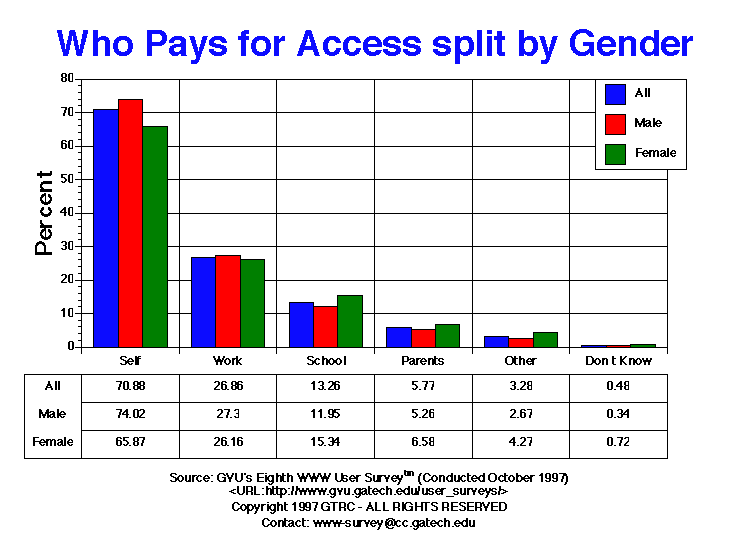
| Self | 7165.00 70.88% |
4602.00 74.02% |
2563.00 65.87% |
6257.00 73.53% |
334.00 49.55% |
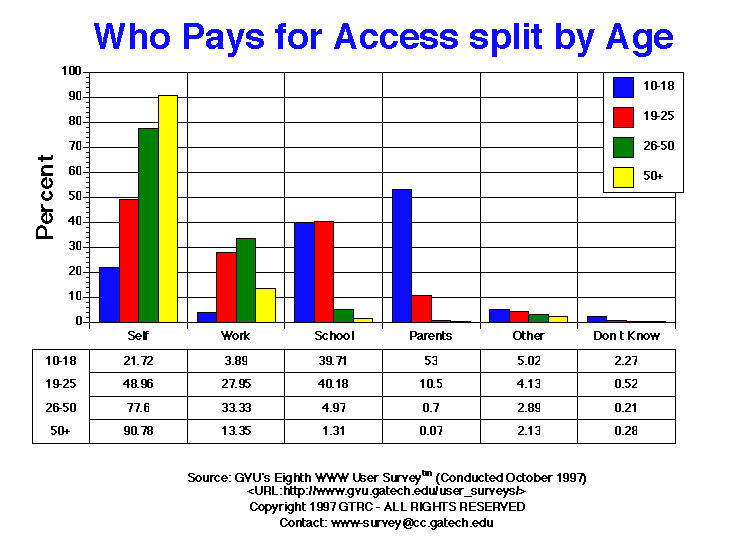
134.00 21.72% |
937.00 48.96% |
4438.00 77.60% |
1319.00 90.78% |
3000.00 81.04% |
2494.00 64.53% |
334.00 49.55% |
| Parents | 583.00 5.77% |
327.00 5.26% |
256.00 6.58% |
474.00 5.57% |
33.00 4.90% |
327.00 53.00% |
201.00 10.50% |
40.00 0.70% |
1.00 0.07% |
211.00 5.70% |
267.00 6.91% |
33.00 4.90% |
| Work | 2715.00 26.86% |
1697.00 27.30% |
1018.00 26.16% |
2023.00 23.77% |
377.00 55.93% |
24.00 3.89% |
535.00 27.95% |
1906.00 33.33% |
194.00 13.35% |
314.00 8.48% |
1166.00 30.17% |
377.00 55.93% |
| School | 1340.00 13.26% |
743.00 11.95% |
597.00 15.34% |
1076.00 12.64% |
130.00 19.29% |
245.00 39.71% |
769.00 40.18% |
284.00 4.97% |
19.00 1.31% |
261.00 7.05% |
661.00 17.10% |
130.00 19.29% |
| Other | 332.00 3.28% |
166.00 2.67% |
166.00 4.27% |
266.00 3.13% |
25.00 3.71% |
31.00 5.02% |
79.00 4.13% |
165.00 2.89% |
31.00 2.13% |
130.00 3.51% |
127.00 3.29% |
25.00 3.71% |
| Don't Know | 49.00 0.48% |
21.00 0.34% |
28.00 0.72% |
40.00 0.47% |
4.00 0.59% |
14.00 2.27% |
10.00 0.52% |
12.00 0.21% |
4.00 0.28% |
18.00 0.49% |
26.00 0.67% |
4.00 0.59% |


GVU's WWW Surveying Team
Graphics, Visualization, & Usability Center
College of Computing
Georgia Institute of Technology
Atlanta, GA 30332-0280