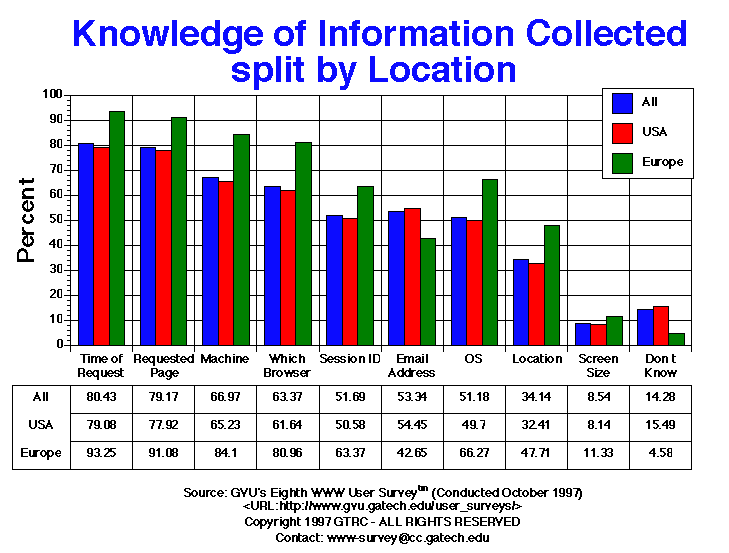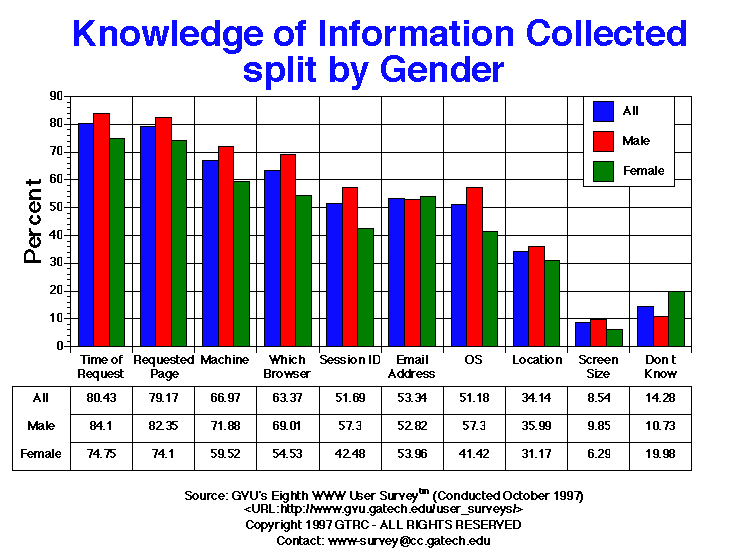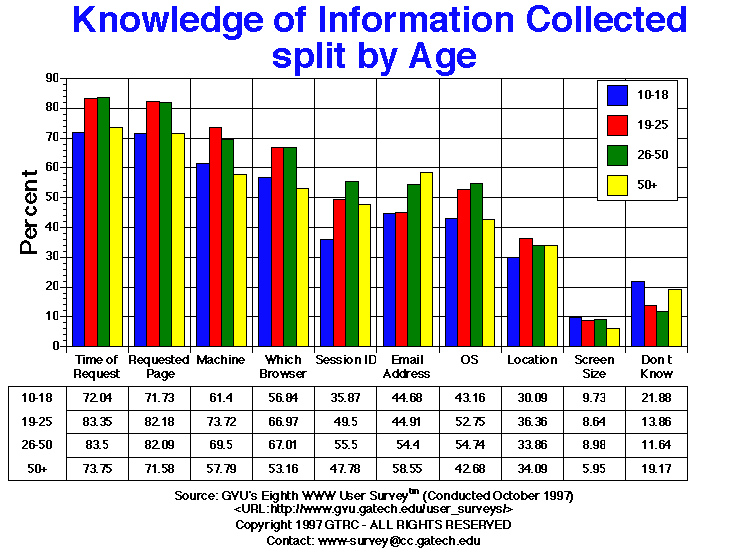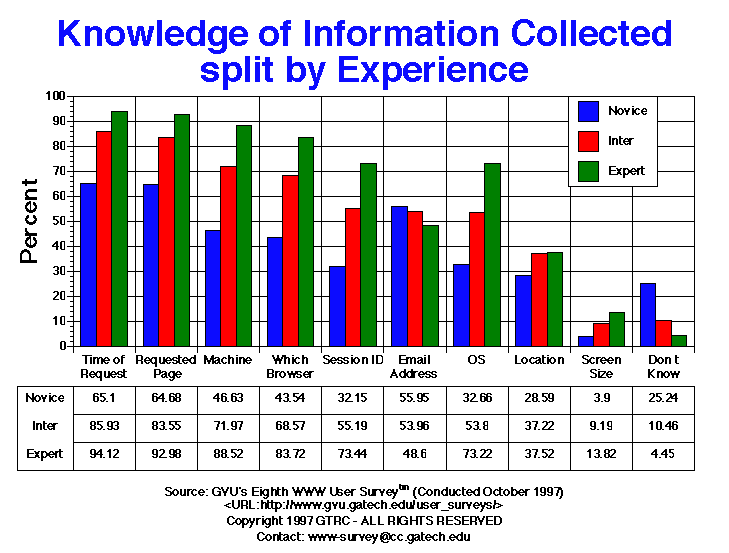

| Knowledge of Information Logged per Page Request | All | Male | Female | USA | Europe | 10-18 | 19-25 | 26-50 | 50+ | Novice | Intermediate | Expert |
| Don't Know | 953.00 14.28% |
440.00 10.73% |
489.00 19.98% |
864.00 15.49% |
19.00 4.58% |
72.00 21.88% |
154.00 13.86% |
443.00 11.64% |
203.00 19.17% |
596.00 25.24% |
255.00 10.46% |
78.00 4.45% |
| Email Address | 3559.00 53.34% |
2166.00 52.82% |
1321.00 53.96% |
3038.00 54.45% |
177.00 42.65% |
147.00 44.68% |
499.00 44.91% |
2071.00 54.40% |
620.00 58.55% |
1321.00 55.95% |
1315.00 53.96% |
851.00 48.60% |
| Location | 2278.00 34.14% |
1476.00 35.99% |
763.00 31.17% |
1808.00 32.41% |
198.00 47.71% |
99.00 30.09% |
404.00 36.36% |
1289.00 33.86% |
361.00 34.09% |
675.00 28.59% |
907.00 37.22% |
657.00 37.52% |
| Machine | 4468.00 66.97% |
2948.00 71.88% |
1457.00 59.52% |
3639.00 65.23% |
349.00 84.10% |
202.00 61.40% |
819.00 73.72% |
2646.00 69.50% |
612.00 57.79% |
1101.00 46.63% |
1754.00 71.97% |
1550.00 88.52% |
| OS | 3415.00 51.18% |
2350.00 57.30% |
1014.00 41.42% |
2773.00 49.70% |
275.00 66.27% |
142.00 43.16% |
586.00 52.75% |
2084.00 54.74% |
452.00 42.68% |
771.00 32.66% |
1311.00 53.80% |
1282.00 73.22% |
| Requested Page | 5282.00 79.17% |
3377.00 82.35% |
1814.00 74.10% |
4347.00 77.92% |
378.00 91.08% |
236.00 71.73% |
913.00 82.18% |
3125.00 82.09% |
758.00 71.58% |
1527.00 64.68% |
2036.00 83.55% |
1628.00 92.98% |
| Screen Size | 570.00 8.54% |
404.00 9.85% |
154.00 6.29% |
454.00 8.14% |
47.00 11.33% |
32.00 9.73% |
96.00 8.64% |
342.00 8.98% |
63.00 5.95% |
92.00 3.90% |
224.00 9.19% |
242.00 13.82% |
| Session ID | 3449.00 51.69% |
2350.00 57.30% |
1040.00 42.48% |
2822.00 50.58% |
263.00 63.37% |
118.00 35.87% |
550.00 49.50% |
2113.00 55.50% |
506.00 47.78% |
759.00 32.15% |
1345.00 55.19% |
1286.00 73.44% |
| Time of Request | 5366.00 80.43% |
3449.00 84.10% |
1830.00 74.75% |
4412.00 79.08% |
387.00 93.25% |
237.00 72.04% |
926.00 83.35% |
3179.00 83.50% |
781.00 73.75% |
1537.00 65.10% |
2094.00 85.93% |
1648.00 94.12% |
| Which Browser | 4228.00 63.37% |
2830.00 69.01% |
1335.00 54.53% |
3439.00 61.64% |
336.00 80.96% |
187.00 56.84% |
744.00 66.97% |
2551.00 67.01% |
563.00 53.16% |
1028.00 43.54% |
1671.00 68.57% |
1466.00 83.72% |


GVU's WWW Surveying Team
Graphics, Visualization, & Usability Center
College of Computing
Georgia Institute of Technology
Atlanta, GA 30332-0280