
| Mass Emailings | All | Male | Female | USA | Europe | 10-18 | 19-25 | 26-50 | 50+ | Novice | Intermediate | Expert |
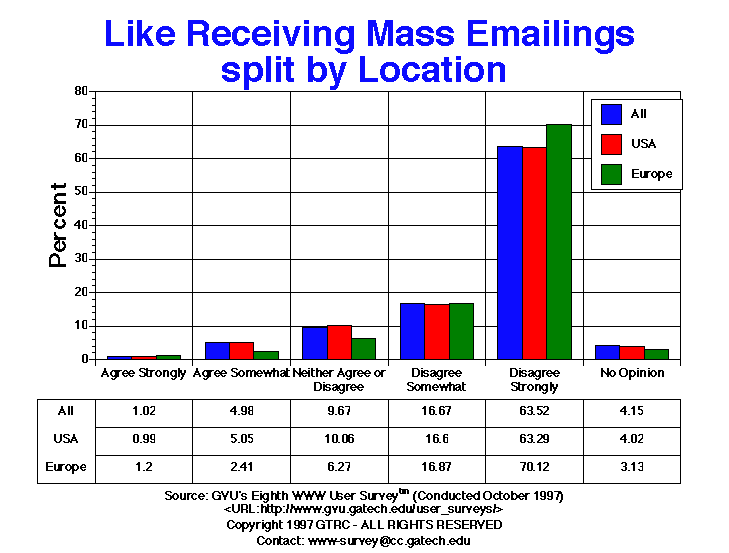
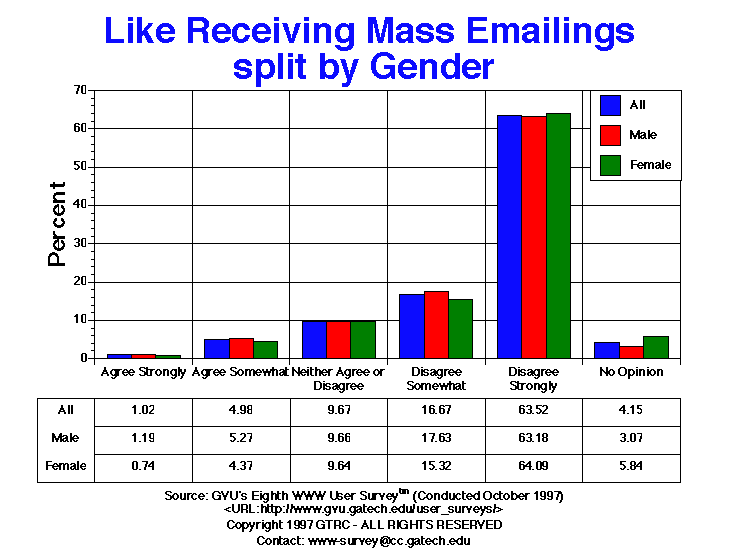
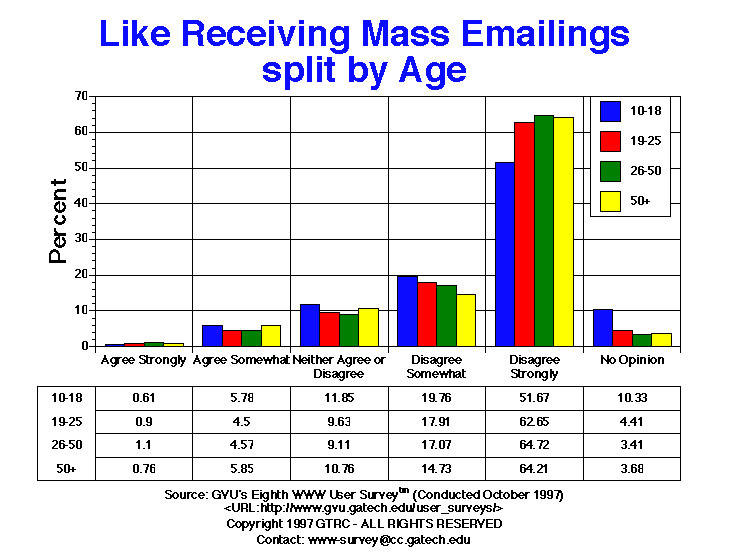
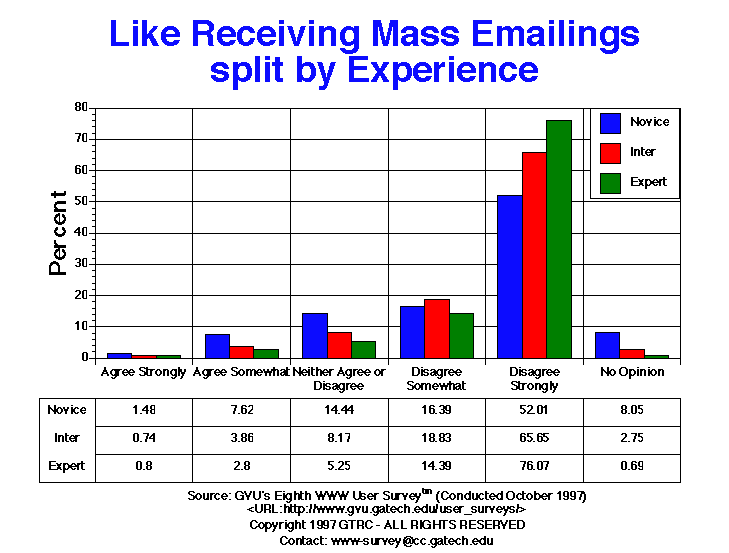
| Agree Somewhat | 332.00 4.98% |
216.00 5.27% |
107.00 4.37% |
282.00 5.05% |
10.00 2.41% |
19.00 5.78% |
50.00 4.50% |
174.00 4.57% |
62.00 5.85% |
180.00 7.62% |
94.00 3.86% |
49.00 2.80% |
| Agree Strongly | 68.00 1.02% |
49.00 1.19% |
18.00 0.74% |
55.00 0.99% |
5.00 1.20% |
2.00 0.61% |
10.00 0.90% |
42.00 1.10% |
8.00 0.76% |
35.00 1.48% |
18.00 0.74% |
14.00 0.80% |
| Disagree Somewhat | 1112.00 16.67% |
723.00 17.63% |
375.00 15.32% |
926.00 16.60% |
70.00 16.87% |
65.00 19.76% |
199.00 17.91% |
650.00 17.07% |
156.00 14.73% |
387.00 16.39% |
459.00 18.83% |
252.00 14.39% |
| Disagree Strongly | 4238.00 63.52% |
2591.00 63.18% |
1569.00 64.09% |
3531.00 63.29% |
291.00 70.12% |
170.00 51.67% |
696.00 62.65% |
2464.00 64.72% |
680.00 64.21% |
1228.00 52.01% |
1600.00 65.65% |
1332.00 76.07% |
| Neither Agree or Disagree | 645.00 9.67% |
396.00 9.66% |
236.00 9.64% |
561.00 10.06% |
26.00 6.27% |
39.00 11.85% |
107.00 9.63% |
347.00 9.11% |
114.00 10.76% |
341.00 14.44% |
199.00 8.17% |
92.00 5.25% |
| No Opinion | 277.00 4.15% |
126.00 3.07% |
143.00 5.84% |
224.00 4.02% |
13.00 3.13% |
34.00 10.33% |
49.00 4.41% |
130.00 3.41% |
39.00 3.68% |
190.00 8.05% |
67.00 2.75% |
12.00 0.69% |


GVU's WWW Surveying Team
Graphics, Visualization, & Usability Center
College of Computing
Georgia Institute of Technology
Atlanta, GA 30332-0280