
| Reasons for Not Registering | All | Male | Female | USA | Europe | 10-18 | 19-25 | 26-50 | 50+ | Novice | Intermediate | Expert |
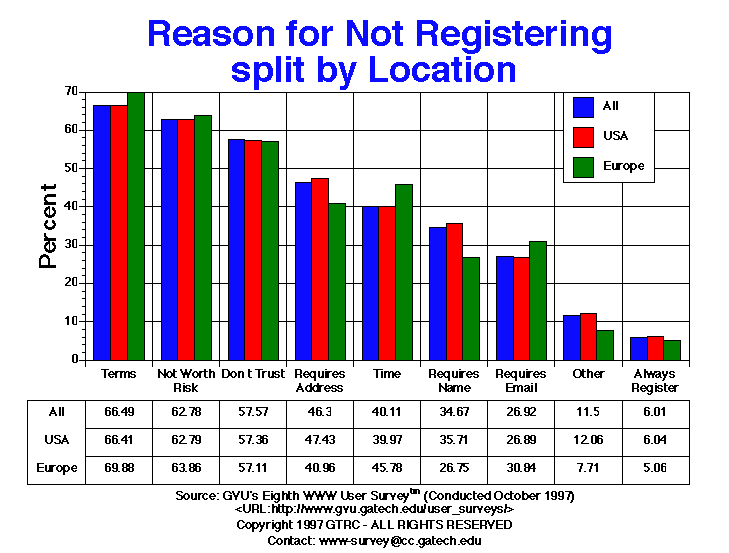
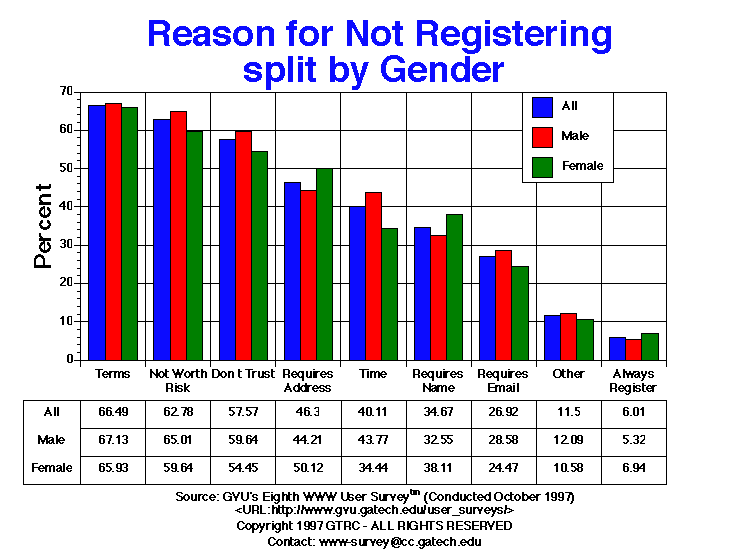
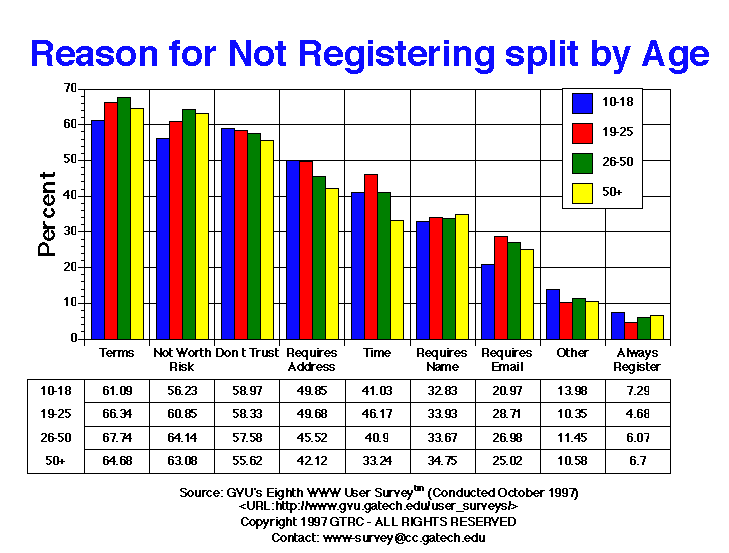
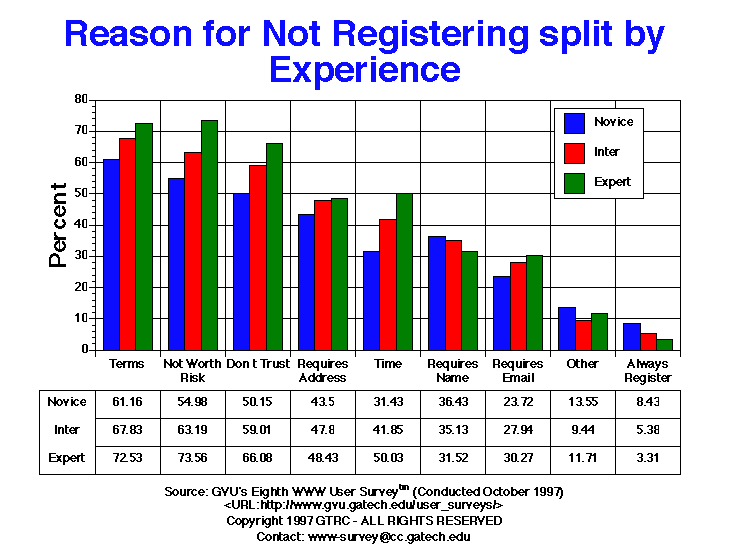
| Always Register | 401.00 6.01% |
218.00 5.32% |
170.00 6.94% |
337.00 6.04% |
21.00 5.06% |
24.00 7.29% |
52.00 4.68% |
231.00 6.07% |
71.00 6.70% |
199.00 8.43% |
131.00 5.38% |
58.00 3.31% |
| Don t Trust | 3841.00 57.57% |
2446.00 59.64% |
1333.00 54.45% |
3200.00 57.36% |
237.00 57.11% |
194.00 58.97% |
648.00 58.33% |
2192.00 57.58% |
589.00 55.62% |
1184.00 50.15% |
1438.00 59.01% |
1157.00 66.08% |
| Not Worth Risk | 4189.00 62.78% |
2666.00 65.01% |
1460.00 59.64% |
3503.00 62.79% |
265.00 63.86% |
185.00 56.23% |
676.00 60.85% |
2442.00 64.14% |
668.00 63.08% |
1298.00 54.98% |
1540.00 63.19% |
1288.00 73.56% |
| Other | 767.00 11.50% |
496.00 12.09% |
259.00 10.58% |
673.00 12.06% |
32.00 7.71% |
46.00 13.98% |
115.00 10.35% |
436.00 11.45% |
112.00 10.58% |
320.00 13.55% |
230.00 9.44% |
205.00 11.71% |
| Requires Address | 3089.00 46.30% |
1813.00 44.21% |
1227.00 50.12% |
2646.00 47.43% |
170.00 40.96% |
164.00 49.85% |
552.00 49.68% |
1733.00 45.52% |
446.00 42.12% |
1027.00 43.50% |
1165.00 47.80% |
848.00 48.43% |
| Requires Email | 1796.00 26.92% |
1172.00 28.58% |
599.00 24.47% |
1500.00 26.89% |
128.00 30.84% |
69.00 20.97% |
319.00 28.71% |
1027.00 26.98% |
265.00 25.02% |
560.00 23.72% |
681.00 27.94% |
530.00 30.27% |
| Requires Name | 2313.00 34.67% |
1335.00 32.55% |
933.00 38.11% |
1992.00 35.71% |
111.00 26.75% |
108.00 32.83% |
377.00 33.93% |
1282.00 33.67% |
368.00 34.75% |
860.00 36.43% |
856.00 35.13% |
552.00 31.52% |
| Terms | 4436.00 66.49% |
2753.00 67.13% |
1614.00 65.93% |
3705.00 66.41% |
290.00 69.88% |
201.00 61.09% |
737.00 66.34% |
2579.00 67.74% |
685.00 64.68% |
1444.00 61.16% |
1653.00 67.83% |
1270.00 72.53% |
| Time | 2676.00 40.11% |
1795.00 43.77% |
843.00 34.44% |
2230.00 39.97% |
190.00 45.78% |
135.00 41.03% |
513.00 46.17% |
1557.00 40.90% |
352.00 33.24% |
742.00 31.43% |
1020.00 41.85% |
876.00 50.03% |


GVU's WWW Surveying Team
Graphics, Visualization, & Usability Center
College of Computing
Georgia Institute of Technology
Atlanta, GA 30332-0280