
| Use of Demographic Information in Other Mediums | All | Male | Female | USA | Europe | 10-18 | 19-25 | 26-50 | 50+ | Novice | Intermediate | Expert |
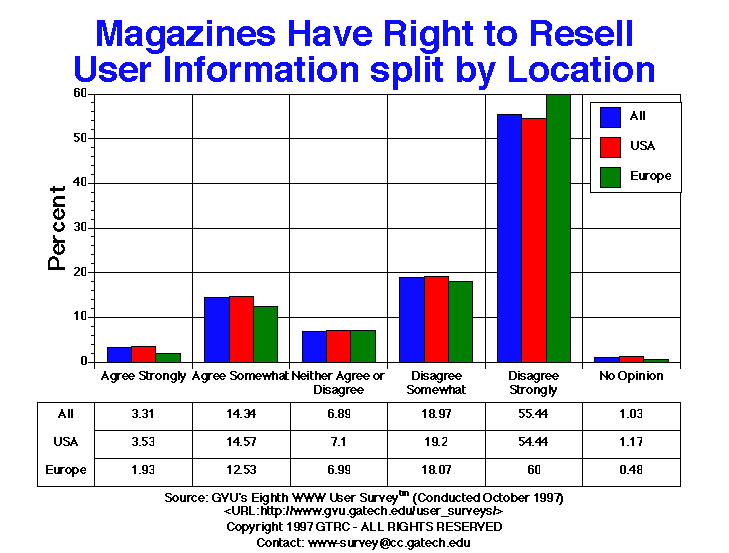
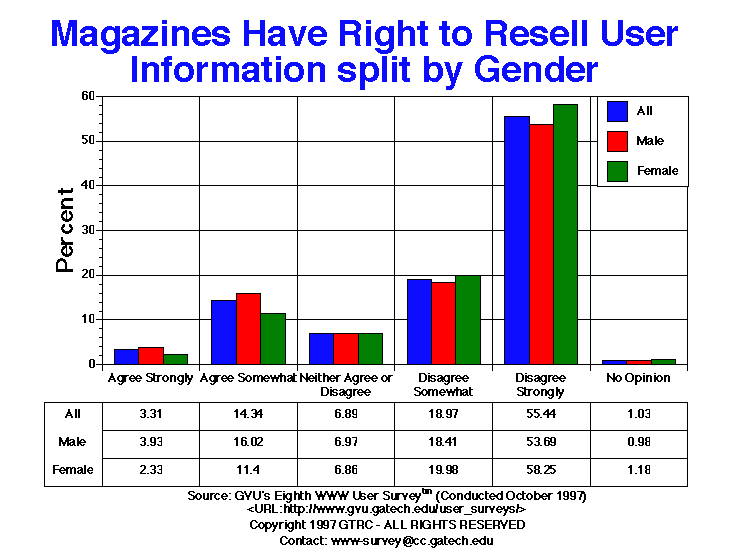
| Agree Somewhat | 957.00 14.34% |
657.00 16.02% |
279.00 11.40% |
813.00 14.57% |
52.00 12.53% |
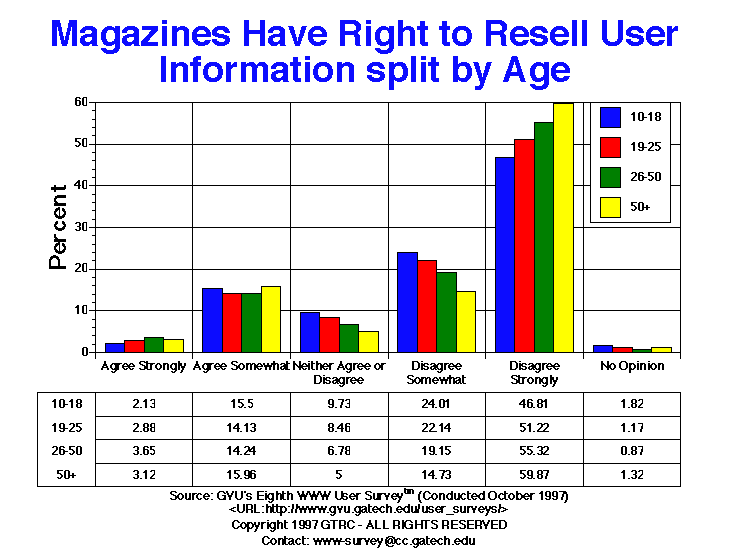
51.00 15.50% |
157.00 14.13% |
542.00 14.24% |
169.00 15.96% |
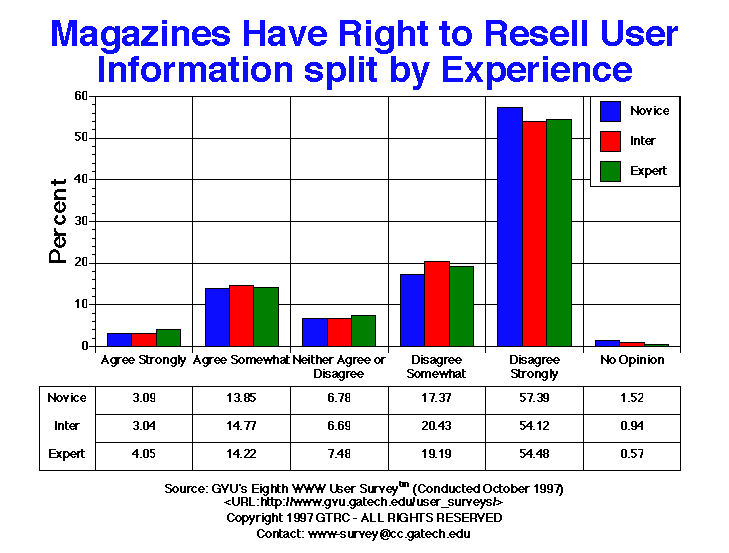
327.00 13.85% |
360.00 14.77% |
249.00 14.22% |
| Agree Strongly | 221.00 3.31% |
161.00 3.93% |
57.00 2.33% |
197.00 3.53% |
8.00 1.93% |
7.00 2.13% |
32.00 2.88% |
139.00 3.65% |
33.00 3.12% |
73.00 3.09% |
74.00 3.04% |
71.00 4.05% |
| Disagree Somewhat | 1266.00 18.97% |
755.00 18.41% |
489.00 19.98% |
1071.00 19.20% |
75.00 18.07% |
79.00 24.01% |
246.00 22.14% |
729.00 19.15% |
156.00 14.73% |
410.00 17.37% |
498.00 20.43% |
336.00 19.19% |
| Disagree Strongly | 3699.00 55.44% |
2202.00 53.69% |
1426.00 58.25% |
3037.00 54.44% |
249.00 60.00% |
154.00 46.81% |
569.00 51.22% |
2106.00 55.32% |
634.00 59.87% |
1355.00 57.39% |
1319.00 54.12% |
954.00 54.48% |
| Neither Agree or Disagree | 460.00 6.89% |
286.00 6.97% |
168.00 6.86% |
396.00 7.10% |
29.00 6.99% |
32.00 9.73% |
94.00 8.46% |
258.00 6.78% |
53.00 5.00% |
160.00 6.78% |
163.00 6.69% |
131.00 7.48% |
| No Opinion | 69.00 1.03% |
40.00 0.98% |
29.00 1.18% |
65.00 1.17% |
2.00 0.48% |
6.00 1.82% |
13.00 1.17% |
33.00 0.87% |
14.00 1.32% |
36.00 1.52% |
23.00 0.94% |
10.00 0.57% |


GVU's WWW Surveying Team
Graphics, Visualization, & Usability Center
College of Computing
Georgia Institute of Technology
Atlanta, GA 30332-0280