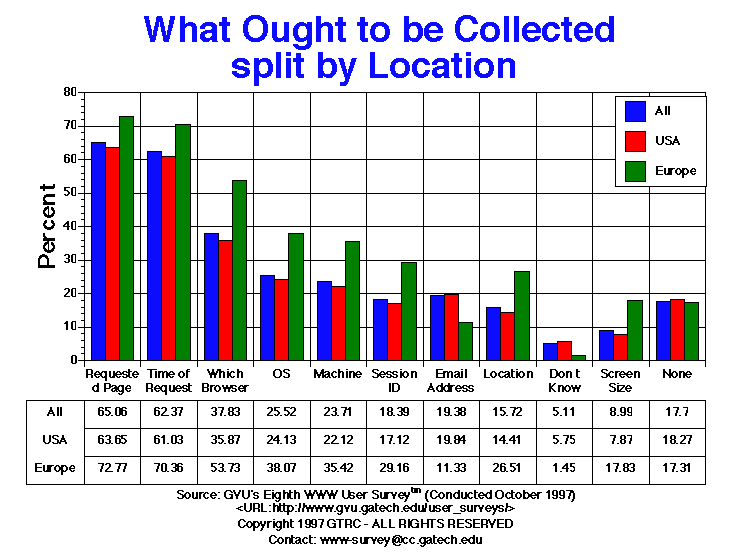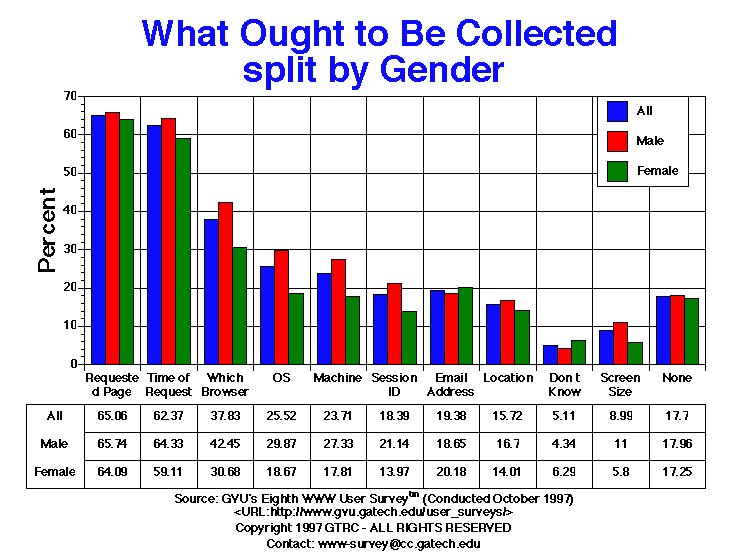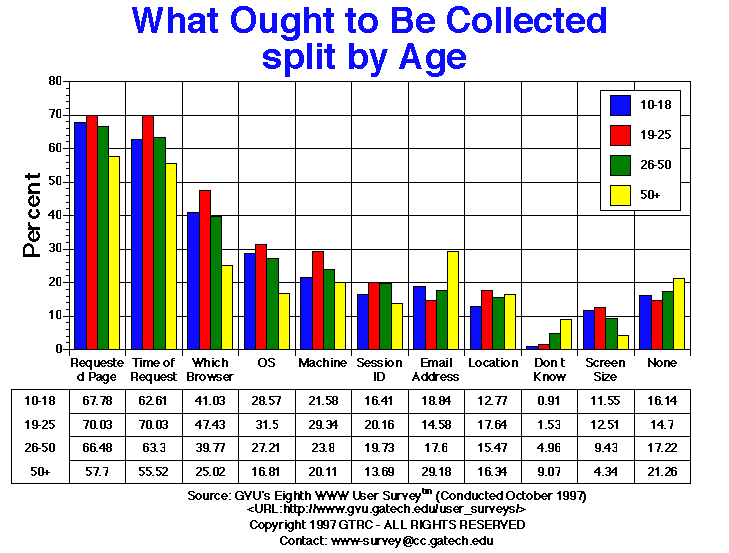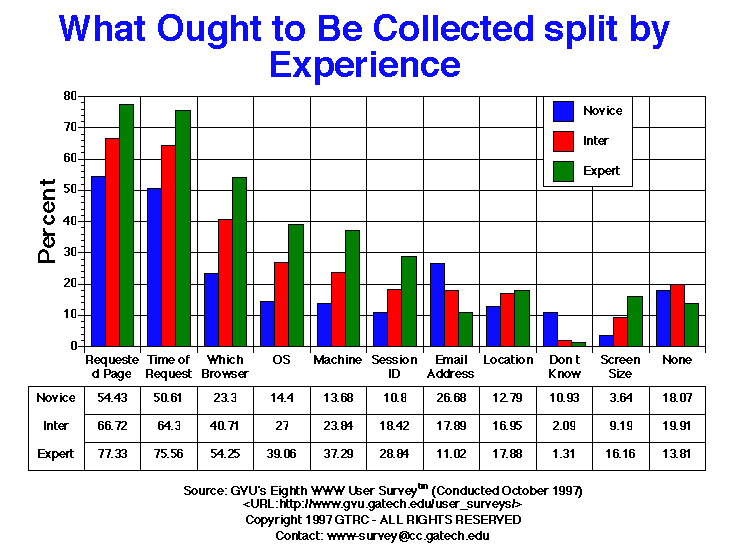

| What Information Ought to be Collected per Page Request | All | Male | Female | USA | Europe | 10-18 | 19-25 | 26-50 | 50+ | Novice | Intermediate | Expert |
| Don't Know | 341.00 5.11% |
178.00 4.34% |
154.00 6.29% |
321.00 5.75% |
6.00 1.45% |
3.00 0.91% |
17.00 1.53% |
189.00 4.96% |
96.00 9.07% |
258.00 10.93% |
51.00 2.09% |
23.00 1.31% |
| Email Address | 1293.00 19.38% |
765.00 18.65% |
494.00 20.18% |
1107.00 19.84% |
47.00 11.33% |
62.00 18.84% |
162.00 14.58% |
670.00 17.60% |
309.00 29.18% |
630.00 26.68% |
436.00 17.89% |
193.00 11.02% |
| Location | 1049.00 15.72% |
685.00 16.70% |
343.00 14.01% |
804.00 14.41% |
110.00 26.51% |
42.00 12.77% |
196.00 17.64% |
589.00 15.47% |
173.00 16.34% |
302.00 12.79% |
413.00 16.95% |
313.00 17.88% |
| Machine | 1582.00 23.71% |
1121.00 27.33% |
436.00 17.81% |
1234.00 22.12% |
147.00 35.42% |
71.00 21.58% |
326.00 29.34% |
906.00 23.80% |
213.00 20.11% |
323.00 13.68% |
581.00 23.84% |
653.00 37.29% |
| None | 1072.00 17.70% |
672.00 17.96% |
387.00 17.25% |
945.00 18.27% |
58.00 17.31% |
51.00 16.14% |
148.00 14.70% |
593.00 17.22% |
210.00 21.26% |
417.00 18.07% |
438.00 19.91% |
204.00 13.81% |
| OS | 1703.00 25.52% |
1225.00 29.87% |
457.00 18.67% |
1346.00 24.13% |
158.00 38.07% |
94.00 28.57% |
350.00 31.50% |
1036.00 27.21% |
178.00 16.81% |
340.00 14.40% |
658.00 27.00% |
684.00 39.06% |
| Requested Page | 4341.00 65.06% |
2696.00 65.74% |
1569.00 64.09% |
3551.00 63.65% |
302.00 72.77% |
223.00 67.78% |
778.00 70.03% |
2531.00 66.48% |
611.00 57.70% |
1285.00 54.43% |
1626.00 66.72% |
1354.00 77.33% |
| Screen Size | 600.00 8.99% |
451.00 11.00% |
142.00 5.80% |
439.00 7.87% |
74.00 17.83% |
38.00 11.55% |
139.00 12.51% |
359.00 9.43% |
46.00 4.34% |
86.00 3.64% |
224.00 9.19% |
283.00 16.16% |
| Session ID | 1227.00 18.39% |
867.00 21.14% |
342.00 13.97% |
955.00 17.12% |
121.00 29.16% |
54.00 16.41% |
224.00 20.16% |
751.00 19.73% |
145.00 13.69% |
255.00 10.80% |
449.00 18.42% |
505.00 28.84% |
| Time of Request | 4161.00 62.37% |
2638.00 64.33% |
1447.00 59.11% |
3405.00 61.03% |
292.00 70.36% |
206.00 62.61% |
778.00 70.03% |
2410.00 63.30% |
588.00 55.52% |
1195.00 50.61% |
1567.00 64.30% |
1323.00 75.56% |
| Which Browser | 2524.00 37.83% |
1741.00 42.45% |
751.00 30.68% |
2001.00 35.87% |
223.00 53.73% |
135.00 41.03% |
527.00 47.43% |
1514.00 39.77% |
265.00 25.02% |
550.00 23.30% |
992.00 40.71% |
950.00 54.25% |


GVU's WWW Surveying Team
Graphics, Visualization, & Usability Center
College of Computing
Georgia Institute of Technology
Atlanta, GA 30332-0280