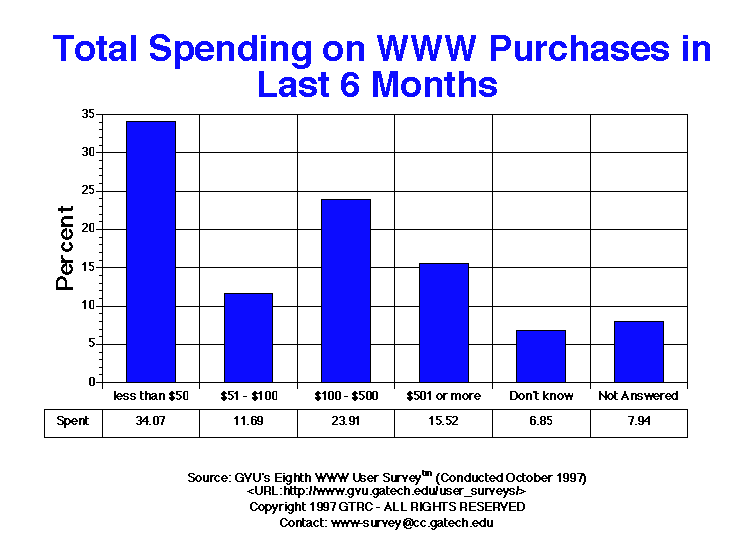

The largest category of respondents has spent less than $50 (US) on the web (34%) while the next largest category has spent $100-$500 (24%). 16% of respondents have spent over $500 on the web in the last six months. These figures are consistent with the previous survey.
| Total Spending On WWW Purchases | All | Male | Female | USA | Europe | 10-18 | 19-25 | 26-50 | 50+ | Novice | Intermediate | Expert |
| $100 - $500 | 593.00 23.91% |
396.00 25.22% |
193.00 21.88% |
494.00 23.72% |
38.00 23.60% |
4.00 6.78% |
77.00 21.39% |
383.00 25.77% |
118.00 25.16% |
140.00 17.07% |
227.00 26.36% |
222.00 28.79% |
| $501 or more | 385.00 15.52% |
294.00 18.73% |
87.00 9.86% |
322.00 15.46% |
25.00 15.53% |
5.00 8.47% |
44.00 12.22% |
252.00 16.96% |
75.00 15.99% |
53.00 6.46% |
127.00 14.75% |
201.00 26.07% |
| $51 - $100 | 283.00 11.41% |
196.00 12.48% |
83.00 9.41% |
238.00 11.43% |
15.00 9.32% |
7.00 11.86% |
39.00 10.83% |
174.00 11.71% |
52.00 11.09% |
91.00 11.10% |
110.00 12.78% |
78.00 10.12% |
| Don't know | 161.00 6.49% |
95.00 6.05% |
63.00 7.14% |
133.00 6.39% |
17.00 10.56% |
4.00 6.78% |
23.00 6.39% |
79.00 5.32% |
37.00 7.89% |
74.00 9.02% |
38.00 4.41% |
46.00 5.97% |
| Not Answered | 197.00 7.94% |
109.00 6.94% |
85.00 9.64% |
170.00 8.16% |
13.00 8.07% |
5.00 8.47% |
21.00 5.83% |
111.00 7.47% |
46.00 9.81% |
90.00 10.98% |
66.00 7.67% |
38.00 4.93% |
| less than $50 | 842.00 33.95% |
470.00 29.94% |
363.00 41.16% |
713.00 34.23% |
49.00 30.43% |
34.00 57.63% |
154.00 42.78% |
478.00 32.17% |
136.00 29.00% |
367.00 44.76% |
283.00 32.87% |
183.00 23.74% |

GVU's WWW Surveying Team
Graphics, Visualization, & Usability Center
College of Computing
Georgia Institute of Technology
Atlanta, GA 30332-0280