
| Dissatisfying Experiences | All | Male | Female | USA | Europe | 10-18 | 19-25 | 26-50 | 50+ | Novice | Intermediate | Expert |
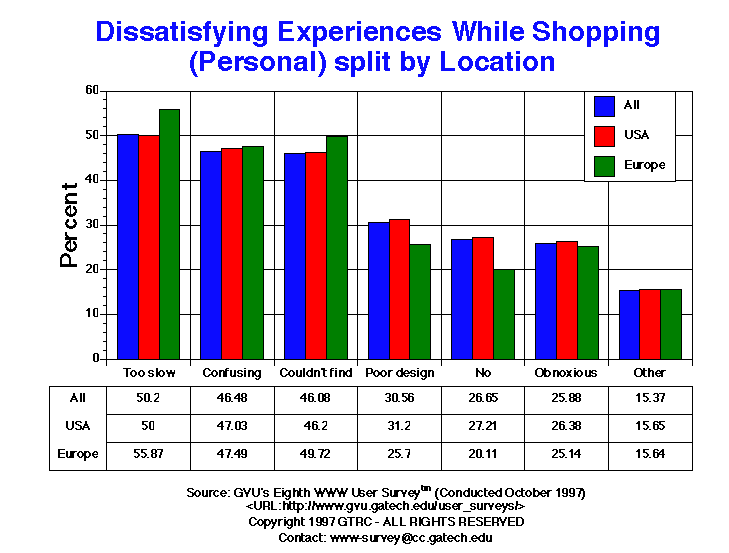
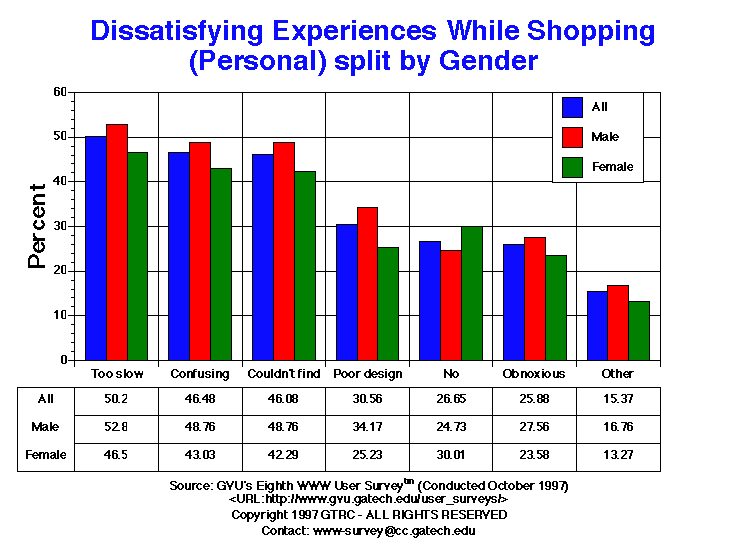
| Confusing | 1512.00 46.48% |
966.00 48.76% |
522.00 43.03% |
1298.00 47.03% |
85.00 47.49% |
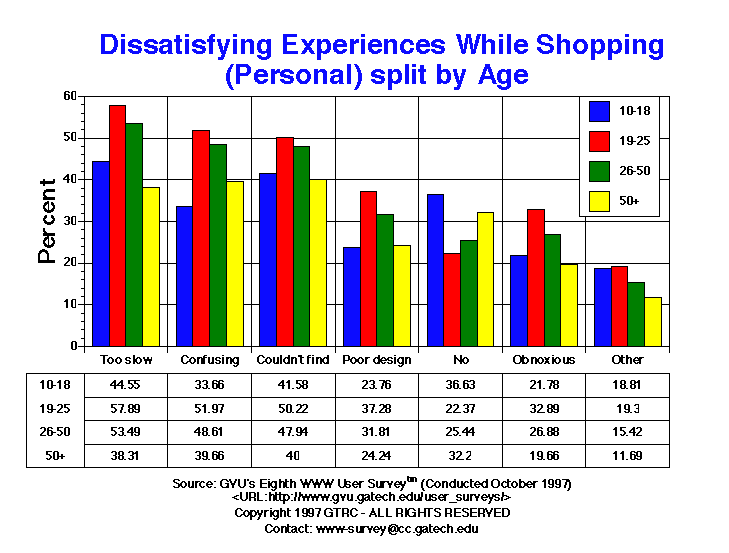
34.00 33.66% |
237.00 51.97% |
946.00 48.61% |
234.00 39.66% |
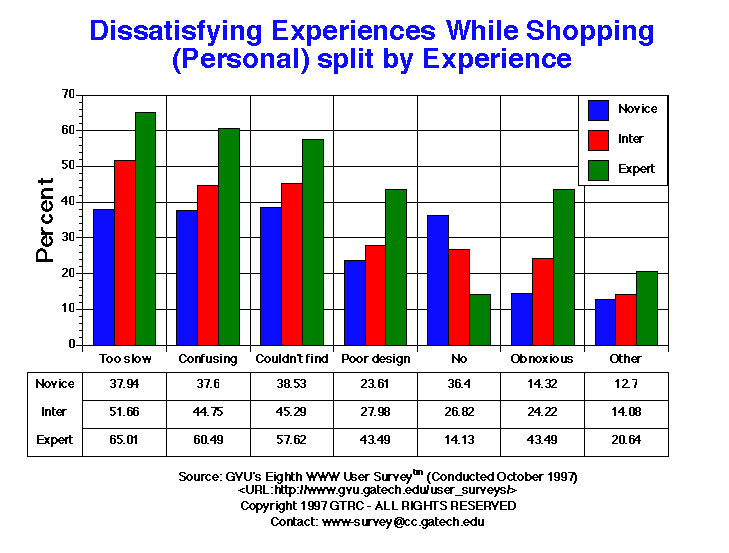
441.00 37.60% |
499.00 44.75% |
548.00 60.49% |
| Couldn't find | 1499.00 46.08% |
966.00 48.76% |
513.00 42.29% |
1275.00 46.20% |
89.00 49.72% |
42.00 41.58% |
229.00 50.22% |
933.00 47.94% |
236.00 40.00% |
452.00 38.53% |
505.00 45.29% |
522.00 57.62% |
| No | 867.00 26.65% |
490.00 24.73% |
364.00 30.01% |
751.00 27.21% |
36.00 20.11% |
37.00 36.63% |
102.00 22.37% |
495.00 25.44% |
190.00 32.20% |
427.00 36.40% |
299.00 26.82% |
128.00 14.13% |
| Obnoxious | 842.00 25.88% |
546.00 27.56% |
286.00 23.58% |
728.00 26.38% |
45.00 25.14% |
22.00 21.78% |
150.00 32.89% |
523.00 26.88% |
116.00 19.66% |
168.00 14.32% |
270.00 24.22% |
394.00 43.49% |
| Other | 500.00 15.37% |
332.00 16.76% |
161.00 13.27% |
432.00 15.65% |
28.00 15.64% |
19.00 18.81% |
88.00 19.30% |
300.00 15.42% |
69.00 11.69% |
149.00 12.70% |
157.00 14.08% |
187.00 20.64% |
| Poor design | 994.00 30.56% |
677.00 34.17% |
306.00 25.23% |
861.00 31.20% |
46.00 25.70% |
24.00 23.76% |
170.00 37.28% |
619.00 31.81% |
143.00 24.24% |
277.00 23.61% |
312.00 27.98% |
394.00 43.49% |
| Too slow | 1633.00 50.20% |
1046.00 52.80% |
564.00 46.50% |
1380.00 50.00% |
100.00 55.87% |
45.00 44.55% |
264.00 57.89% |
1041.00 53.49% |
226.00 38.31% |
445.00 37.94% |
576.00 51.66% |
589.00 65.01% |


GVU's WWW Surveying Team
Graphics, Visualization, & Usability Center
College of Computing
Georgia Institute of Technology
Atlanta, GA 30332-0280