
| Intentional Searches Professional | All | Male | Female | USA | Europe | 10-18 | 19-25 | 26-50 | 50+ | Novice | Intermediate | Expert |
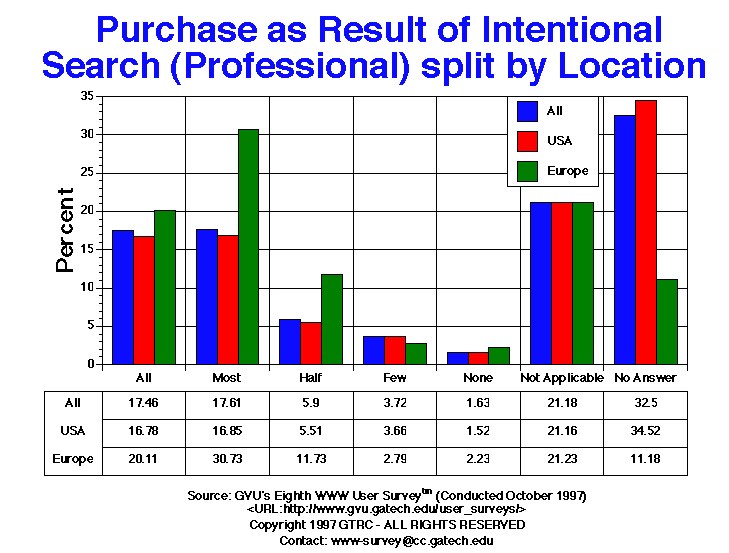
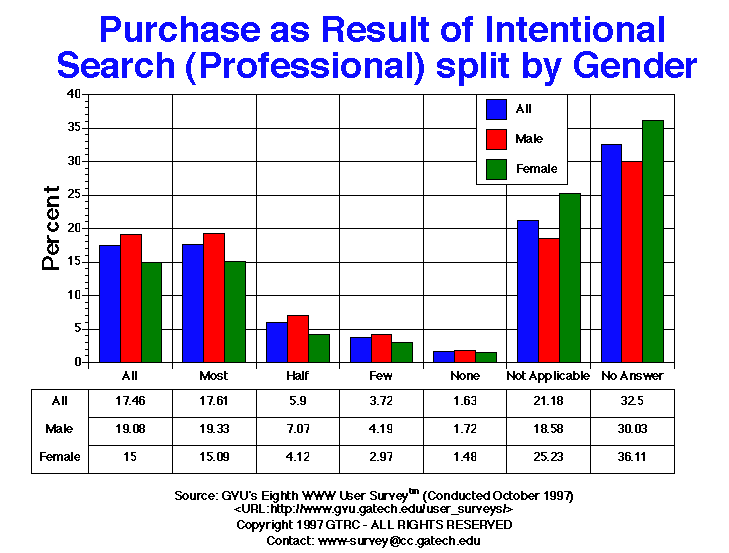
| All | 568.00 17.46% |
378.00 19.08% |
182.00 15.00% |
463.00 16.78% |
36.00 20.11% |
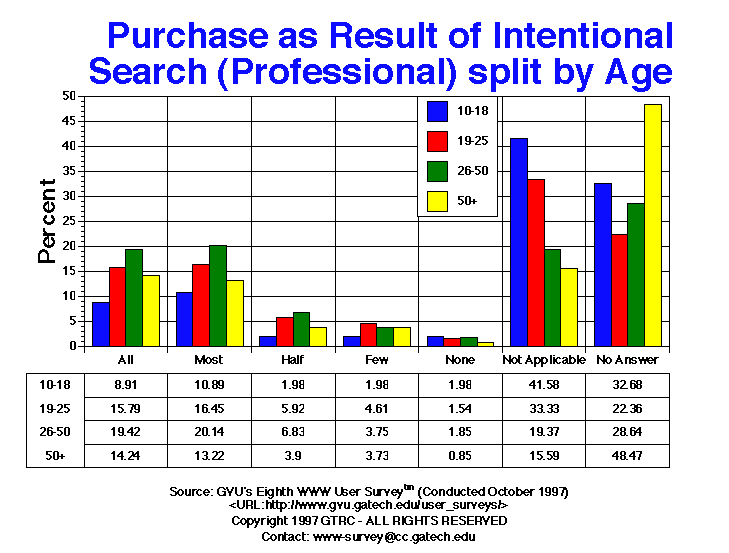
9.00 8.91% |
72.00 15.79% |
378.00 19.42% |
84.00 14.24% |
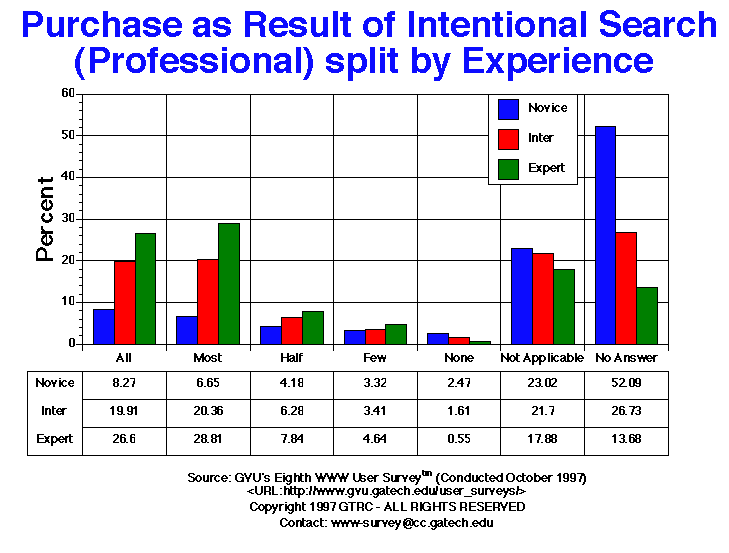
97.00 8.27% |
222.00 19.91% |
241.00 26.60% |
| Few | 121.00 3.72% |
83.00 4.19% |
36.00 2.97% |
101.00 3.66% |
5.00 2.79% |
2.00 1.98% |
21.00 4.61% |
73.00 3.75% |
22.00 3.73% |
39.00 3.32% |
38.00 3.41% |
42.00 4.64% |
| Half | 192.00 5.90% |
140.00 7.07% |
50.00 4.12% |
152.00 5.51% |
21.00 11.73% |
2.00 1.98% |
27.00 5.92% |
133.00 6.83% |
23.00 3.90% |
49.00 4.18% |
70.00 6.28% |
71.00 7.84% |
| Most | 573.00 17.61% |
383.00 19.33% |
183.00 15.09% |
465.00 16.85% |
55.00 30.73% |
11.00 10.89% |
75.00 16.45% |
392.00 20.14% |
78.00 13.22% |
78.00 6.65% |
227.00 20.36% |
261.00 28.81% |
| None | 53.00 1.63% |
34.00 1.72% |
18.00 1.48% |
42.00 1.52% |
4.00 2.23% |
2.00 1.98% |
7.00 1.54% |
36.00 1.85% |
5.00 0.85% |
29.00 2.47% |
18.00 1.61% |
5.00 0.55% |
| Not Applicable | 689.00 21.18% |
368.00 18.58% |
306.00 25.23% |
584.00 21.16% |
38.00 21.23% |
42.00 41.58% |
152.00 33.33% |
377.00 19.37% |
92.00 15.59% |
270.00 23.02% |
242.00 21.70% |
162.00 17.88% |


GVU's WWW Surveying Team
Graphics, Visualization, & Usability Center
College of Computing
Georgia Institute of Technology
Atlanta, GA 30332-0280