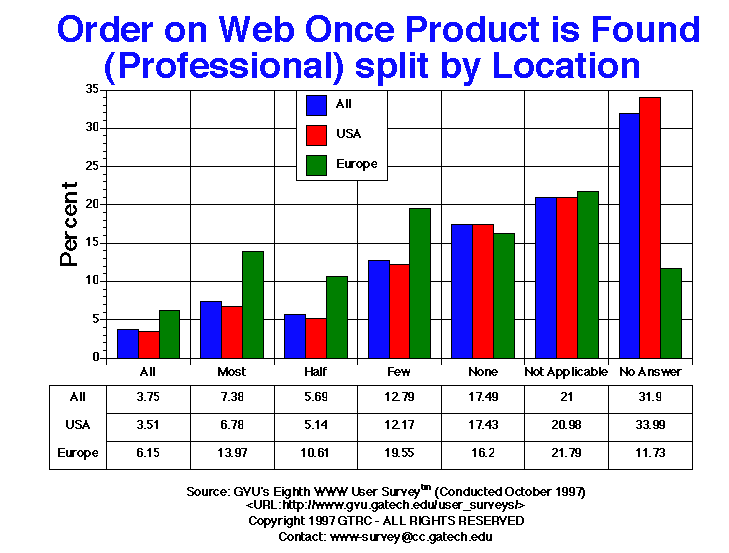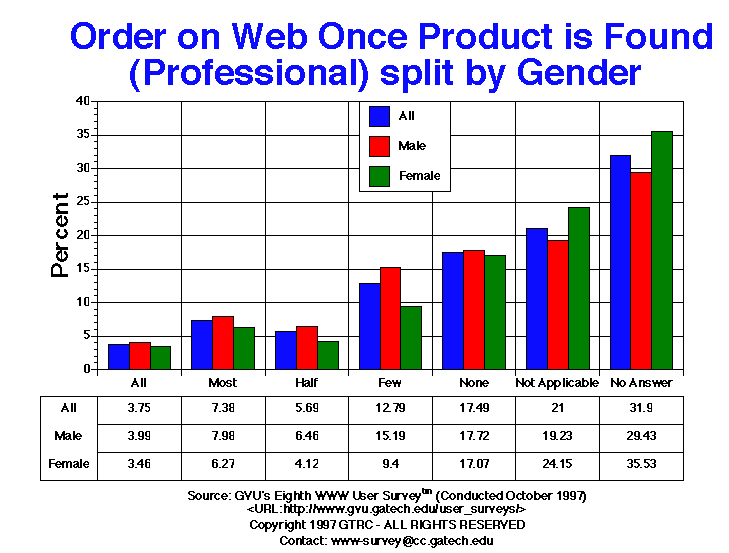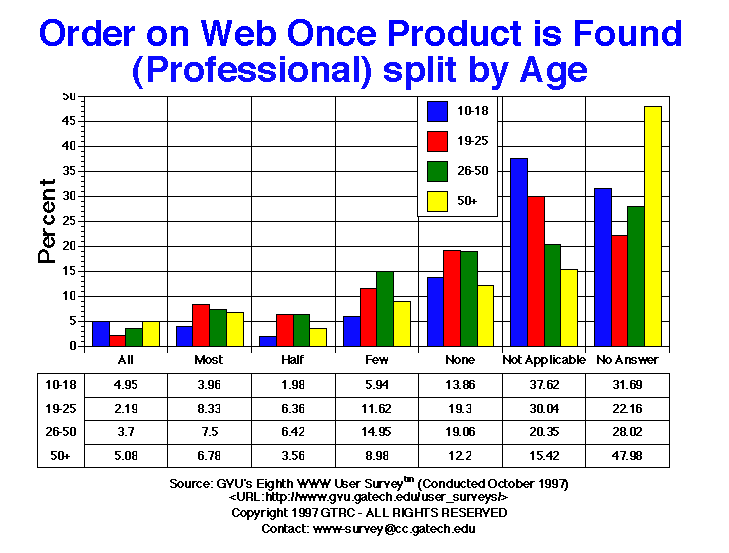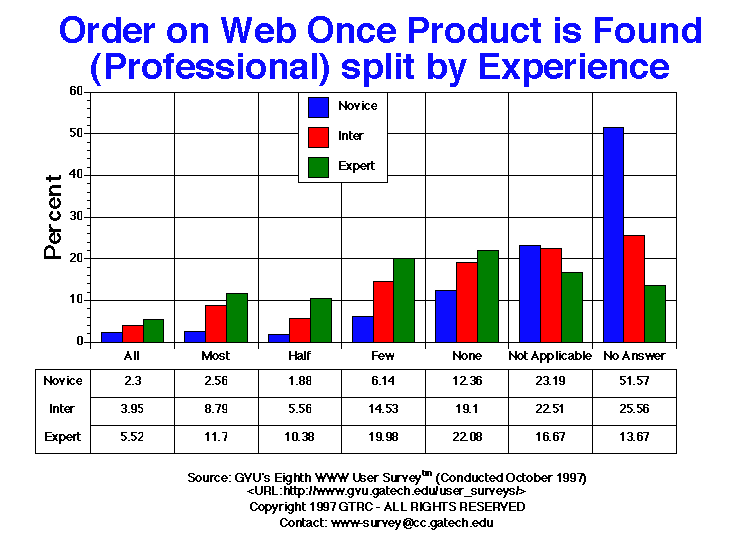

| Ordering on the Web Professional | All | Male | Female | USA | Europe | 10-18 | 19-25 | 26-50 | 50+ | Novice | Intermediate | Expert |
| All | 122.00 3.75% |
79.00 3.99% |
42.00 3.46% |
97.00 3.51% |
11.00 6.15% |
5.00 4.95% |
10.00 2.19% |
72.00 3.70% |
30.00 5.08% |
27.00 2.30% |
44.00 3.95% |
50.00 5.52% |
| Few | 416.00 12.79% |
301.00 15.19% |
114.00 9.40% |
336.00 12.17% |
35.00 19.55% |
6.00 5.94% |
53.00 11.62% |
291.00 14.95% |
53.00 8.98% |
72.00 6.14% |
162.00 14.53% |
181.00 19.98% |
| Half | 185.00 5.69% |
128.00 6.46% |
50.00 4.12% |
142.00 5.14% |
19.00 10.61% |
2.00 1.98% |
29.00 6.36% |
125.00 6.42% |
21.00 3.56% |
22.00 1.88% |
62.00 5.56% |
94.00 10.38% |
| Most | 240.00 7.38% |
158.00 7.98% |
76.00 6.27% |
187.00 6.78% |
25.00 13.97% |
4.00 3.96% |
38.00 8.33% |
146.00 7.50% |
40.00 6.78% |
30.00 2.56% |
98.00 8.79% |
106.00 11.70% |
| None | 569.00 17.49% |
351.00 17.72% |
207.00 17.07% |
481.00 17.43% |
29.00 16.20% |
14.00 13.86% |
88.00 19.30% |
371.00 19.06% |
72.00 12.20% |
145.00 12.36% |
213.00 19.10% |
200.00 22.08% |
| Not Applicable | 683.00 21.00% |
381.00 19.23% |
293.00 24.15% |
579.00 20.98% |
39.00 21.79% |
38.00 37.62% |
137.00 30.04% |
396.00 20.35% |
91.00 15.42% |
272.00 23.19% |
251.00 22.51% |
151.00 16.67% |


GVU's WWW Surveying Team
Graphics, Visualization, & Usability Center
College of Computing
Georgia Institute of Technology
Atlanta, GA 30332-0280