
| Purchasing Decisions Personal | All | Male | Female | USA | Europe | 10-18 | 19-25 | 26-50 | 50+ | Novice | Intermediate | Expert |
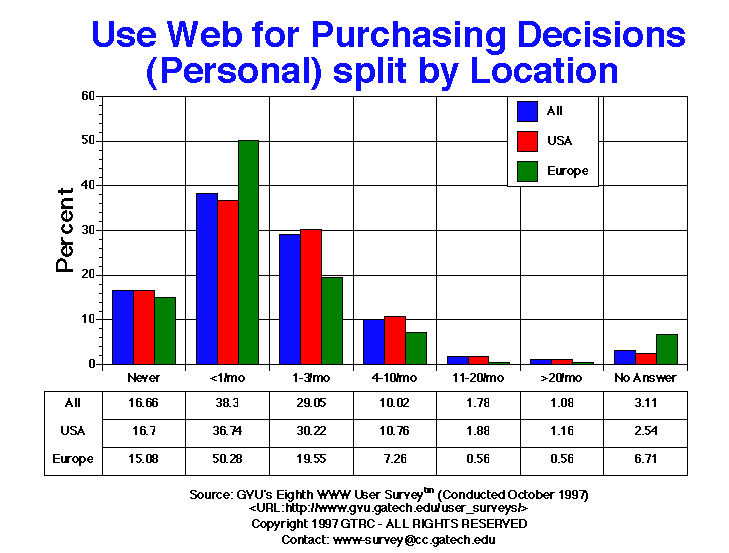
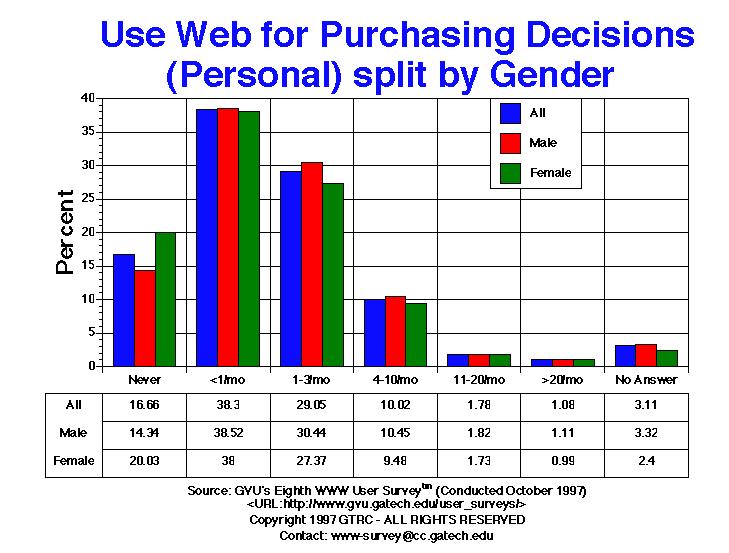
| 1-3/mo | 945.00 29.05% |
603.00 30.44% |
332.00 27.37% |
834.00 30.22% |
35.00 19.55% |
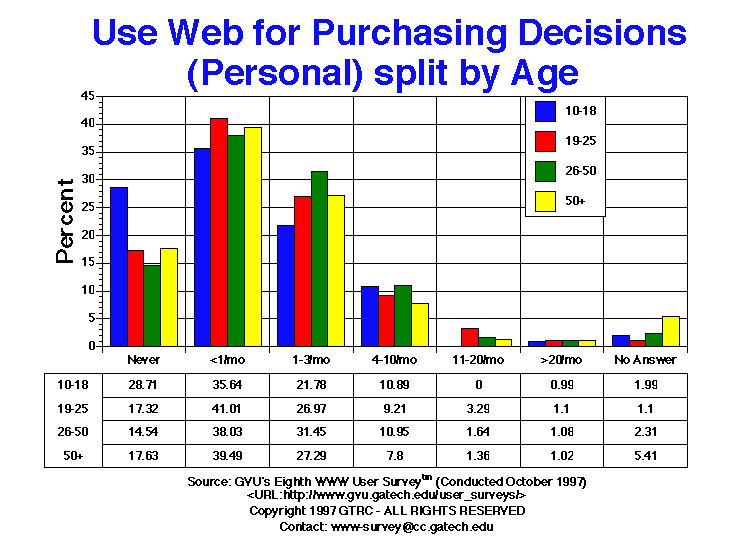
22.00 21.78% |
123.00 26.97% |
612.00 31.45% |
161.00 27.29% |
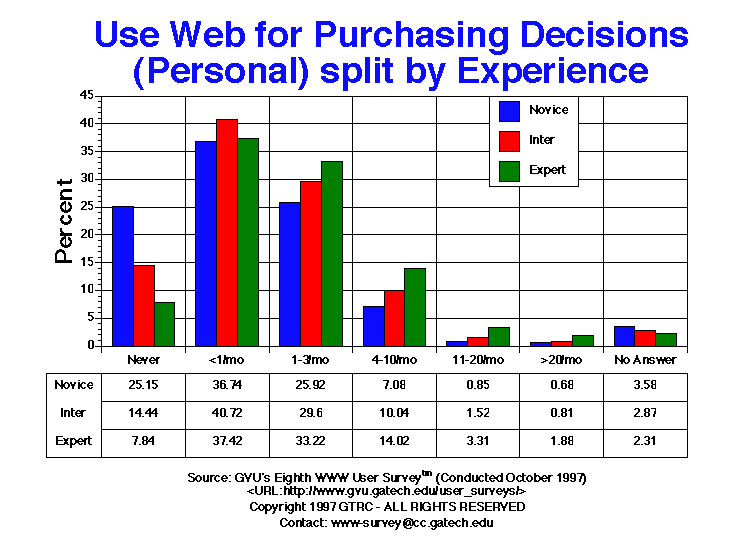
304.00 25.92% |
330.00 29.60% |
301.00 33.22% |
| 11-20/mo | 58.00 1.78% |
36.00 1.82% |
21.00 1.73% |
52.00 1.88% |
1.00 0.56% |
0.00 0.00% |
15.00 3.29% |
32.00 1.64% |
8.00 1.36% |
10.00 0.85% |
17.00 1.52% |
30.00 3.31% |
| 4-10/mo | 326.00 10.02% |
207.00 10.45% |
115.00 9.48% |
297.00 10.76% |
13.00 7.26% |
11.00 10.89% |
42.00 9.21% |
213.00 10.95% |
46.00 7.80% |
83.00 7.08% |
112.00 10.04% |
127.00 14.02% |
| <1/mo | 1246.00 38.30% |
763.00 38.52% |
461.00 38.00% |
1014.00 36.74% |
90.00 50.28% |
36.00 35.64% |
187.00 41.01% |
740.00 38.03% |
233.00 39.49% |
431.00 36.74% |
454.00 40.72% |
339.00 37.42% |
| >20/mo | 35.00 1.08% |
22.00 1.11% |
12.00 0.99% |
32.00 1.16% |
1.00 0.56% |
1.00 0.99% |
5.00 1.10% |
21.00 1.08% |
6.00 1.02% |
8.00 0.68% |
9.00 0.81% |
17.00 1.88% |
| Never | 542.00 16.66% |
284.00 14.34% |
243.00 20.03% |
461.00 16.70% |
27.00 15.08% |
29.00 28.71% |
79.00 17.32% |
283.00 14.54% |
104.00 17.63% |
295.00 25.15% |
161.00 14.44% |
71.00 7.84% |


GVU's WWW Surveying Team
Graphics, Visualization, & Usability Center
College of Computing
Georgia Institute of Technology
Atlanta, GA 30332-0280