
| Reasons for Using the Web | All | Male | Female | USA | Europe | 10-18 | 19-25 | 26-50 | 50+ | Novice | Intermediate | Expert |
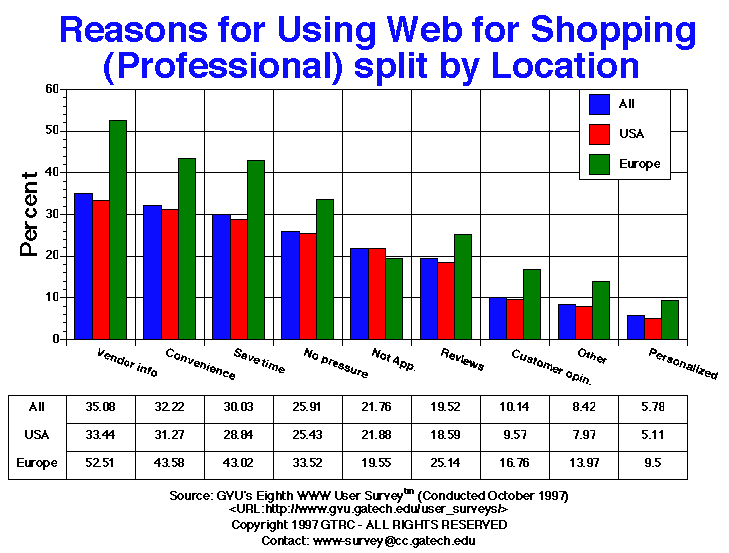
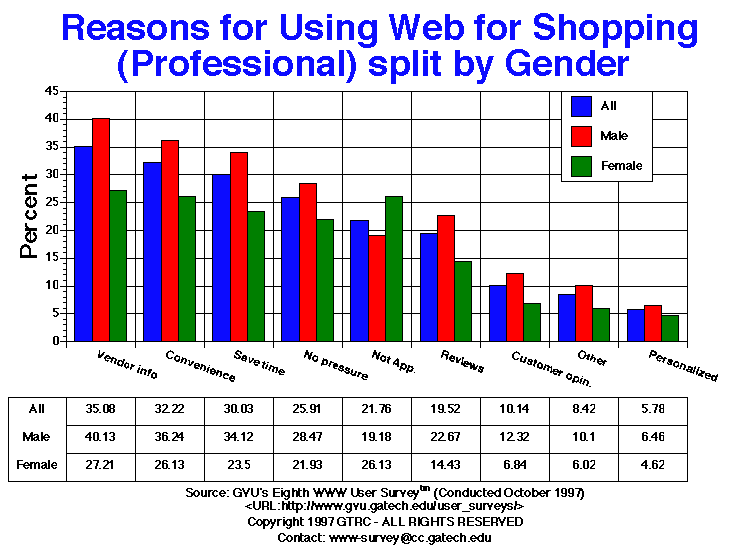
| Convenience | 1048.00 32.22% |
718.00 36.24% |
317.00 26.13% |
863.00 31.27% |
78.00 43.58% |
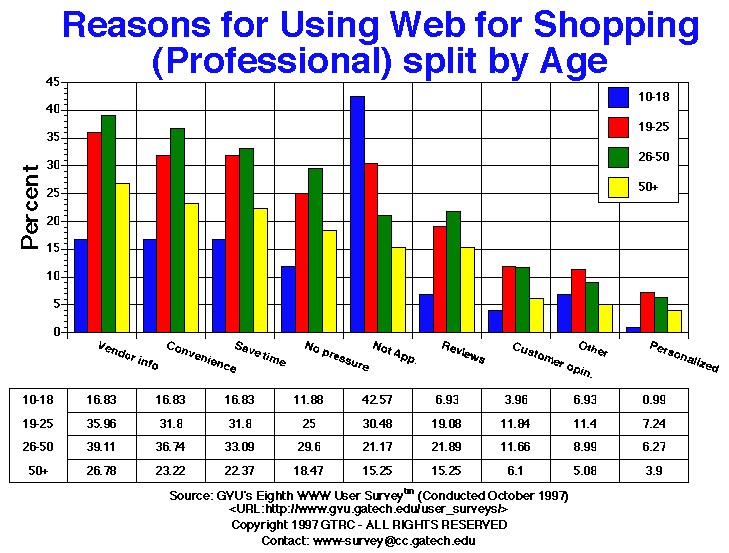
17.00 16.83% |
145.00 31.80% |
715.00 36.74% |
137.00 23.22% |
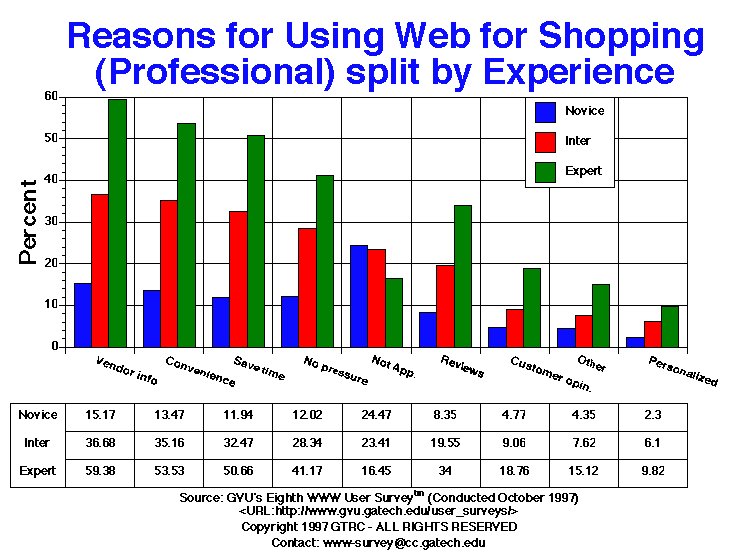
158.00 13.47% |
392.00 35.16% |
485.00 53.53% |
| Customer opinions | 330.00 10.14% |
244.00 12.32% |
83.00 6.84% |
264.00 9.57% |
30.00 16.76% |
4.00 3.96% |
54.00 11.84% |
227.00 11.66% |
36.00 6.10% |
56.00 4.77% |
101.00 9.06% |
170.00 18.76% |
| No pressure | 843.00 25.91% |
564.00 28.47% |
266.00 21.93% |
702.00 25.43% |
60.00 33.52% |
12.00 11.88% |
114.00 25.00% |
576.00 29.60% |
109.00 18.47% |
141.00 12.02% |
316.00 28.34% |
373.00 41.17% |
| Not Applicable | 708.00 21.76% |
380.00 19.18% |
317.00 26.13% |
604.00 21.88% |
35.00 19.55% |
43.00 42.57% |
139.00 30.48% |
412.00 21.17% |
90.00 15.25% |
287.00 24.47% |
261.00 23.41% |
149.00 16.45% |
| Other | 274.00 8.42% |
200.00 10.10% |
73.00 6.02% |
220.00 7.97% |
25.00 13.97% |
7.00 6.93% |
52.00 11.40% |
175.00 8.99% |
30.00 5.08% |
51.00 4.35% |
85.00 7.62% |
137.00 15.12% |
| Personalized | 188.00 5.78% |
128.00 6.46% |
56.00 4.62% |
141.00 5.11% |
17.00 9.50% |
1.00 0.99% |
33.00 7.24% |
122.00 6.27% |
23.00 3.90% |
27.00 2.30% |
68.00 6.10% |
89.00 9.82% |
| Reviews | 635.00 19.52% |
449.00 22.67% |
175.00 14.43% |
513.00 18.59% |
45.00 25.14% |
7.00 6.93% |
87.00 19.08% |
426.00 21.89% |
90.00 15.25% |
98.00 8.35% |
218.00 19.55% |
308.00 34.00% |
| Save time | 977.00 30.03% |
676.00 34.12% |
285.00 23.50% |
796.00 28.84% |
77.00 43.02% |
17.00 16.83% |
145.00 31.80% |
644.00 33.09% |
132.00 22.37% |
140.00 11.94% |
362.00 32.47% |
459.00 50.66% |
| Vendor info | 1141.00 35.08% |
795.00 40.13% |
330.00 27.21% |
923.00 33.44% |
94.00 52.51% |
17.00 16.83% |
164.00 35.96% |
761.00 39.11% |
158.00 26.78% |
178.00 15.17% |
409.00 36.68% |
538.00 59.38% |


GVU's WWW Surveying Team
Graphics, Visualization, & Usability Center
College of Computing
Georgia Institute of Technology
Atlanta, GA 30332-0280