
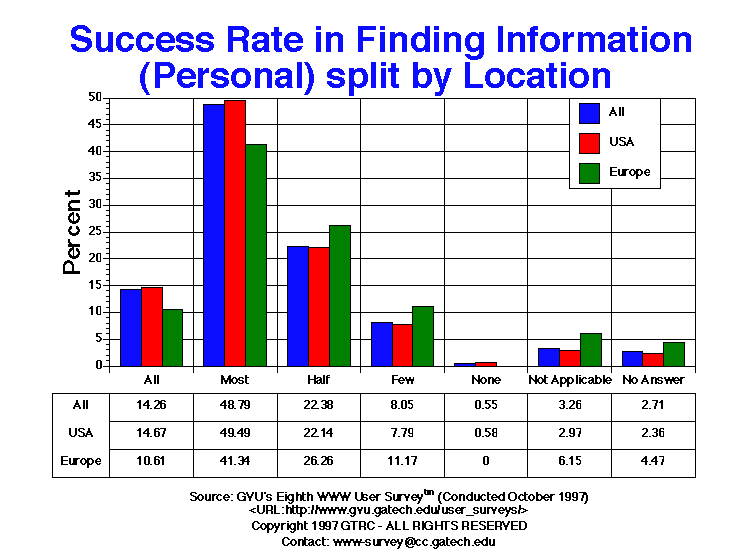
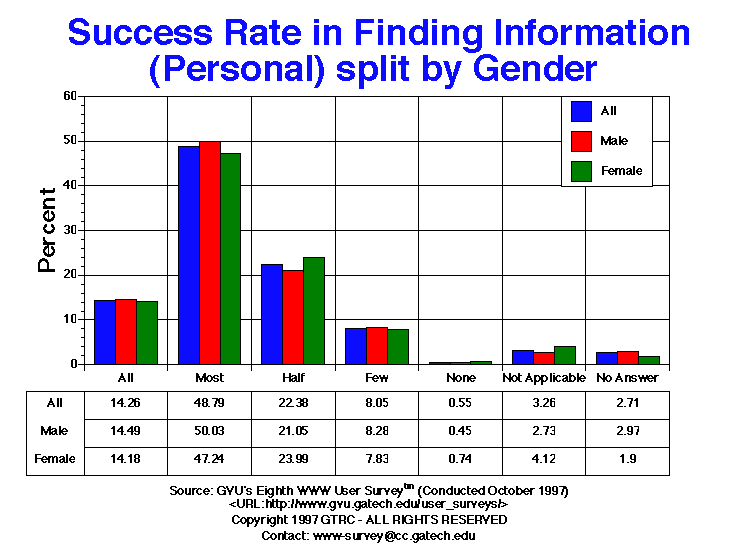
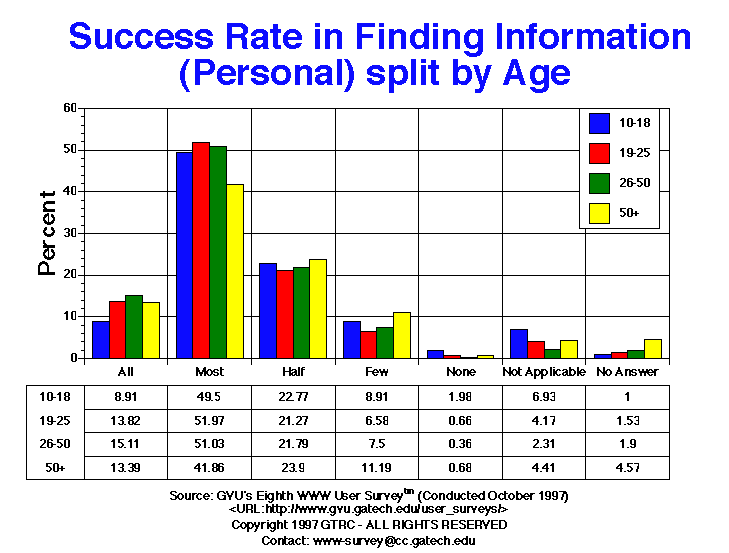
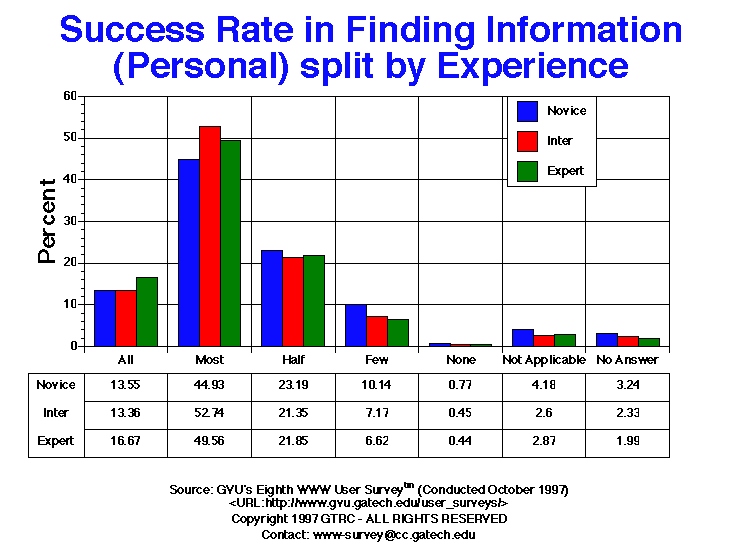
| Success Rate Personal | All | Male | Female | USA | Europe | 10-18 | 19-25 | 26-50 | 50+ | Novice | Intermediate | Expert |
| All | 464.00 14.26% |
287.00 14.49% |
172.00 14.18% |
405.00 14.67% |
19.00 10.61% |
9.00 8.91% |
63.00 13.82% |
294.00 15.11% |
79.00 13.39% |
159.00 13.55% |
149.00 13.36% |
151.00 16.67% |
| Few | 262.00 8.05% |
164.00 8.28% |
95.00 7.83% |
215.00 7.79% |
20.00 11.17% |
9.00 8.91% |
30.00 6.58% |
146.00 7.50% |
66.00 11.19% |
119.00 10.14% |
80.00 7.17% |
60.00 6.62% |
| Half | 728.00 22.38% |
417.00 21.05% |
291.00 23.99% |
611.00 22.14% |
47.00 26.26% |
23.00 22.77% |
97.00 21.27% |
424.00 21.79% |
141.00 23.90% |
272.00 23.19% |
238.00 21.35% |
198.00 21.85% |
| Most | 1587.00 48.79% |
991.00 50.03% |
573.00 47.24% |
1366.00 49.49% |
74.00 41.34% |
50.00 49.50% |
237.00 51.97% |
993.00 51.03% |
247.00 41.86% |
527.00 44.93% |
588.00 52.74% |
449.00 49.56% |
| None | 18.00 0.55% |
9.00 0.45% |
9.00 0.74% |
16.00 0.58% |
0.00 0.00% |
2.00 1.98% |
3.00 0.66% |
7.00 0.36% |
4.00 0.68% |
9.00 0.77% |
5.00 0.45% |
4.00 0.44% |
| Not Applicable | 106.00 3.26% |
54.00 2.73% |
50.00 4.12% |
82.00 2.97% |
11.00 6.15% |
7.00 6.93% |
19.00 4.17% |
45.00 2.31% |
26.00 4.41% |
49.00 4.18% |
29.00 2.60% |
26.00 2.87% |
GVU's WWW Surveying Team
Graphics, Visualization, & Usability Center
College of Computing
Georgia Institute of Technology
Atlanta, GA 30332-0280