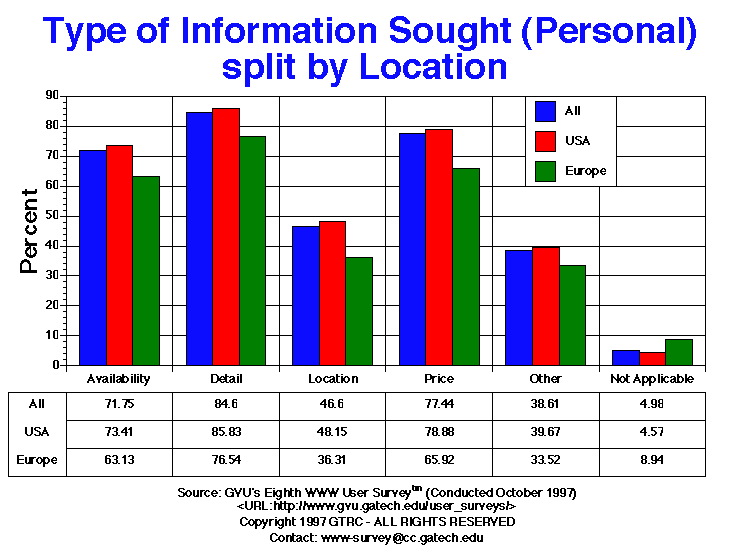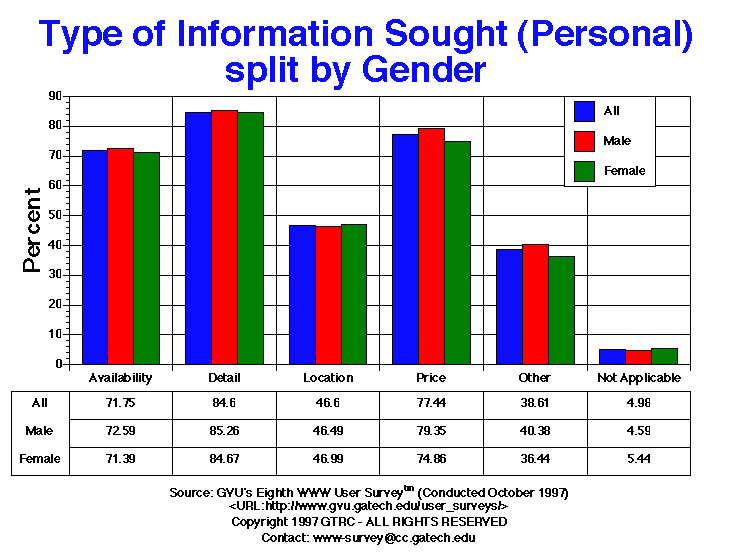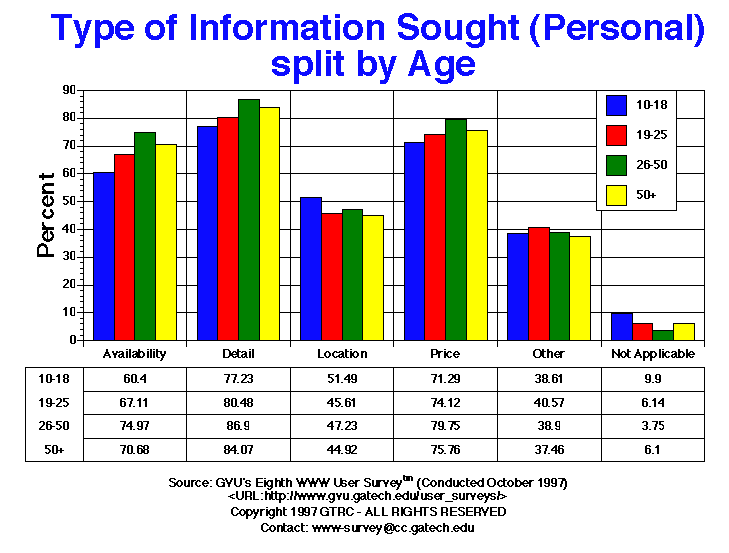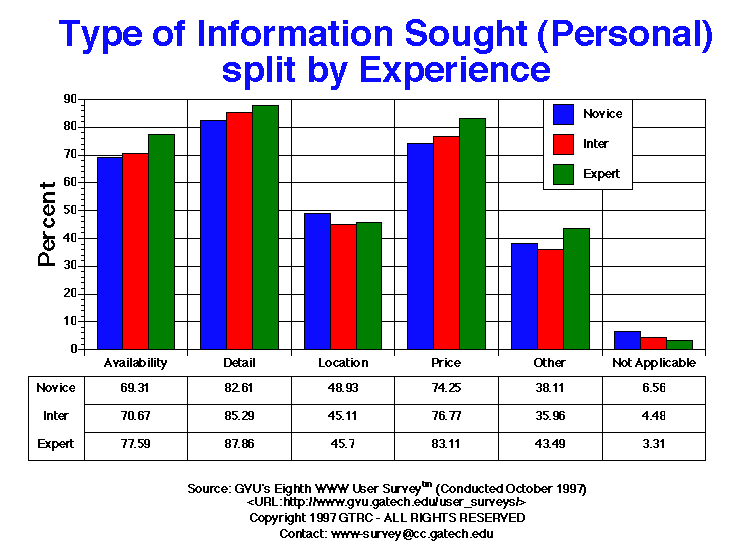

| Type of Information - Personal | All | Male | Female | USA | Europe | 10-18 | 19-25 | 26-50 | 50+ | Novice | Intermediate | Expert |
| Availability | 2334.00 71.75% |
1438.00 72.59% |
866.00 71.39% |
2026.00 73.41% |
113.00 63.13% |
61.00 60.40% |
306.00 67.11% |
1459.00 74.97% |
417.00 70.68% |
813.00 69.31% |
788.00 70.67% |
703.00 77.59% |
| Detail | 2752.00 84.60% |
1689.00 85.26% |
1027.00 84.67% |
2369.00 85.83% |
137.00 76.54% |
78.00 77.23% |
367.00 80.48% |
1691.00 86.90% |
496.00 84.07% |
969.00 82.61% |
951.00 85.29% |
796.00 87.86% |
| Location | 1516.00 46.60% |
921.00 46.49% |
570.00 46.99% |
1329.00 48.15% |
65.00 36.31% |
52.00 51.49% |
208.00 45.61% |
919.00 47.23% |
265.00 44.92% |
574.00 48.93% |
503.00 45.11% |
414.00 45.70% |
| Not Applicable | 162.00 4.98% |
91.00 4.59% |
66.00 5.44% |
126.00 4.57% |
16.00 8.94% |
10.00 9.90% |
28.00 6.14% |
73.00 3.75% |
36.00 6.10% |
77.00 6.56% |
50.00 4.48% |
30.00 3.31% |
| Other | 1256.00 38.61% |
800.00 40.38% |
442.00 36.44% |
1095.00 39.67% |
60.00 33.52% |
39.00 38.61% |
185.00 40.57% |
757.00 38.90% |
221.00 37.46% |
447.00 38.11% |
401.00 35.96% |
394.00 43.49% |
| Price | 2519.00 77.44% |
1572.00 79.35% |
908.00 74.86% |
2177.00 78.88% |
118.00 65.92% |
72.00 71.29% |
338.00 74.12% |
1552.00 79.75% |
447.00 75.76% |
871.00 74.25% |
856.00 76.77% |
753.00 83.11% |


GVU's WWW Surveying Team
Graphics, Visualization, & Usability Center
College of Computing
Georgia Institute of Technology
Atlanta, GA 30332-0280