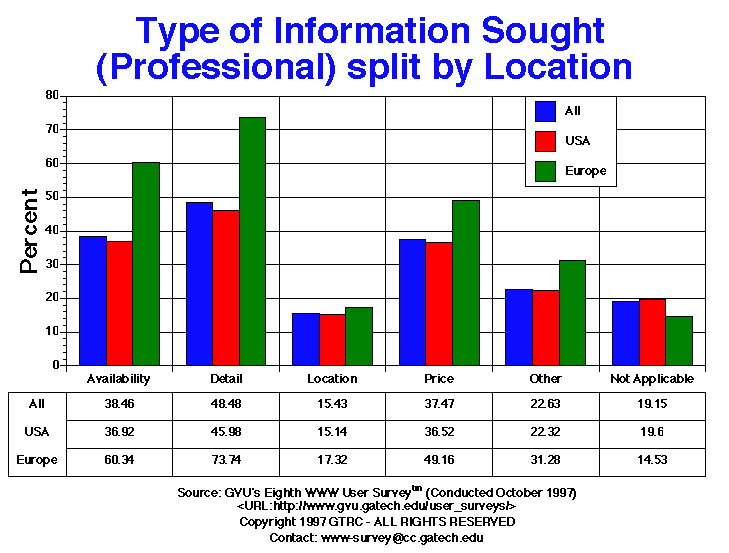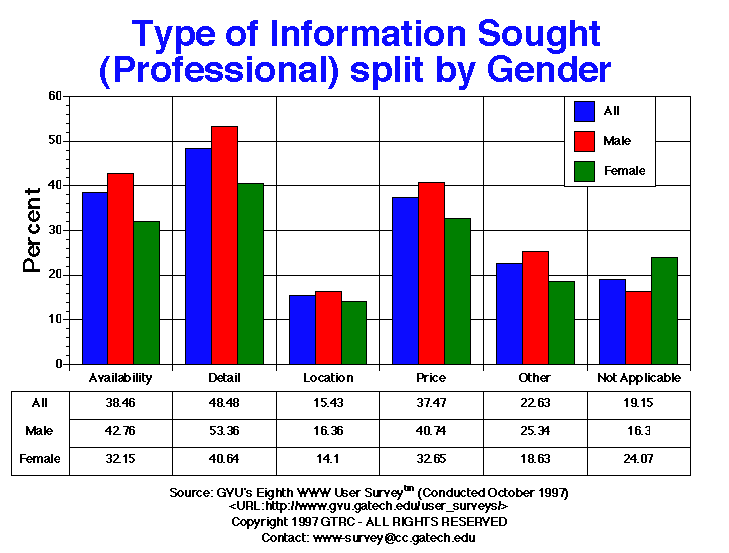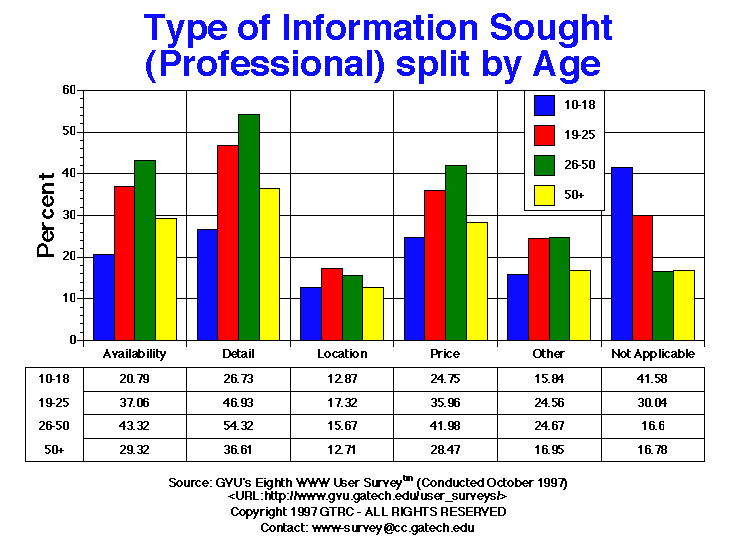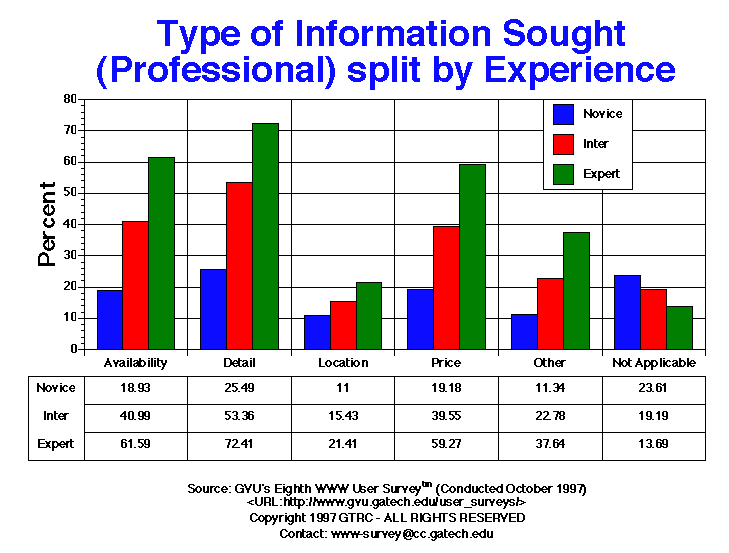

| Type of Information - Professional | All | Male | Female | USA | Europe | 10-18 | 19-25 | 26-50 | 50+ | Novice | Intermediate | Expert |
| Availability | 1251.00 38.46% |
847.00 42.76% |
390.00 32.15% |
1019.00 36.92% |
108.00 60.34% |
21.00 20.79% |
169.00 37.06% |
843.00 43.32% |
173.00 29.32% |
222.00 18.93% |
457.00 40.99% |
558.00 61.59% |
| Detail | 1577.00 48.48% |
1057.00 53.36% |
493.00 40.64% |
1269.00 45.98% |
132.00 73.74% |
27.00 26.73% |
214.00 46.93% |
1057.00 54.32% |
216.00 36.61% |
299.00 25.49% |
595.00 53.36% |
656.00 72.41% |
| Location | 502.00 15.43% |
324.00 16.36% |
171.00 14.10% |
418.00 15.14% |
31.00 17.32% |
13.00 12.87% |
79.00 17.32% |
305.00 15.67% |
75.00 12.71% |
129.00 11.00% |
172.00 15.43% |
194.00 21.41% |
| Not Applicable | 623.00 19.15% |
323.00 16.30% |
292.00 24.07% |
541.00 19.60% |
26.00 14.53% |
42.00 41.58% |
137.00 30.04% |
323.00 16.60% |
99.00 16.78% |
277.00 23.61% |
214.00 19.19% |
124.00 13.69% |
| Other | 736.00 22.63% |
502.00 25.34% |
226.00 18.63% |
616.00 22.32% |
56.00 31.28% |
16.00 15.84% |
112.00 24.56% |
480.00 24.67% |
100.00 16.95% |
133.00 11.34% |
254.00 22.78% |
341.00 37.64% |
| Price | 1219.00 37.47% |
807.00 40.74% |
396.00 32.65% |
1008.00 36.52% |
88.00 49.16% |
25.00 24.75% |
164.00 35.96% |
817.00 41.98% |
168.00 28.47% |
225.00 19.18% |
441.00 39.55% |
537.00 59.27% |


GVU's WWW Surveying Team
Graphics, Visualization, & Usability Center
College of Computing
Georgia Institute of Technology
Atlanta, GA 30332-0280