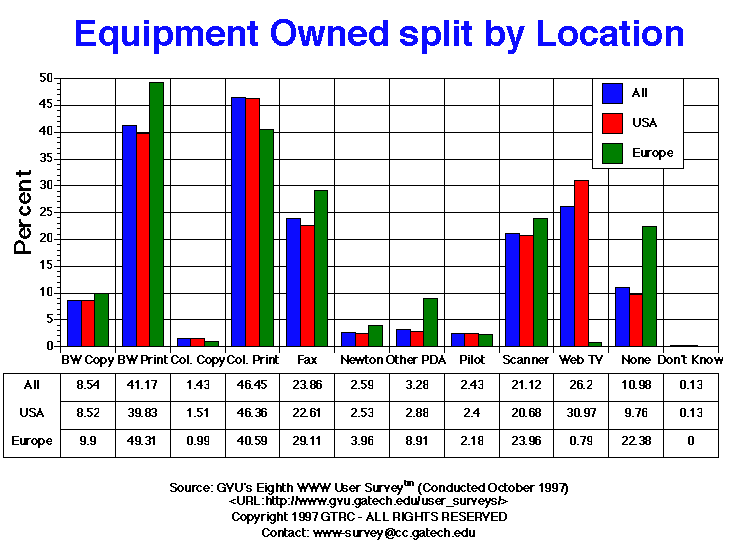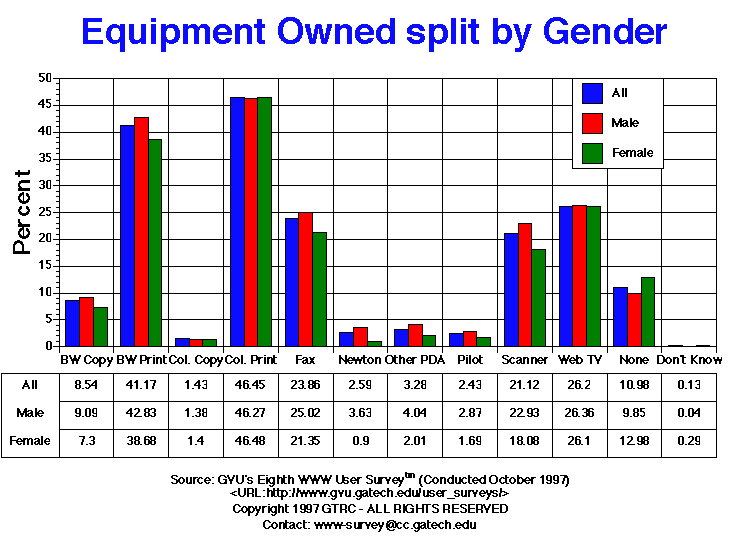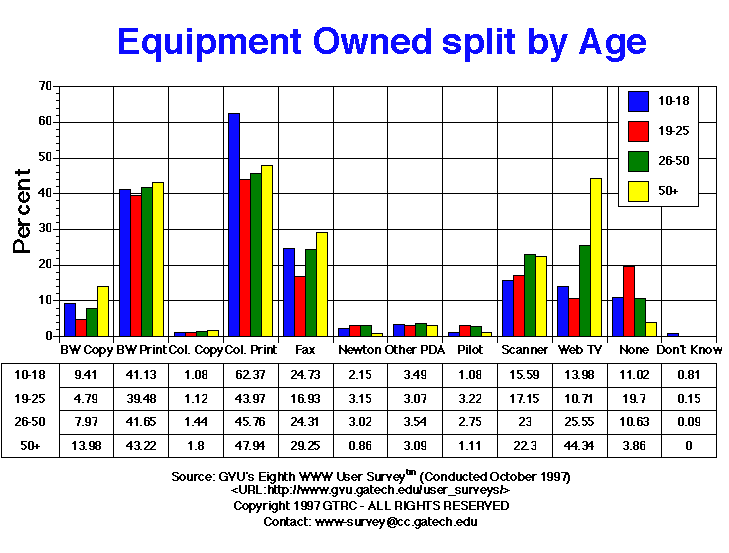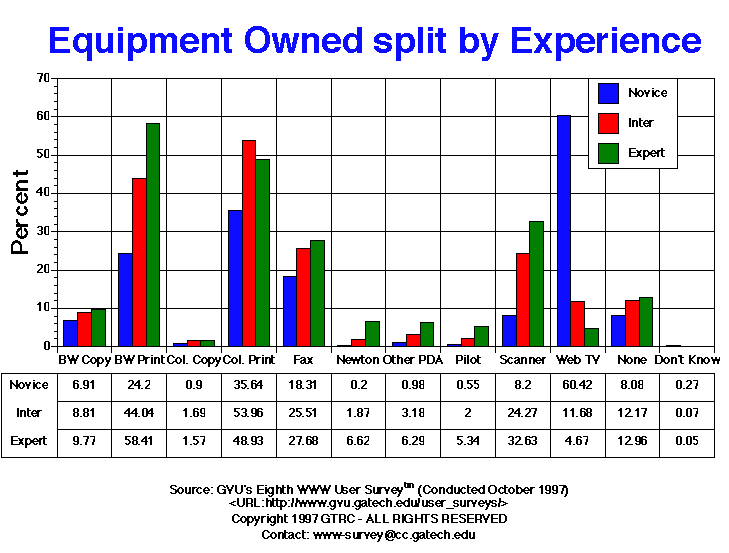

| All | Male | Female | USA | Europe | 10-18 | 19-25 | 26-50 | 50+ | Novice | Intermediate | Expert | |
| B/W Copier | 657.00 8.54% |
434.00 9.09% |
203.00 7.30% |
542.00 8.52% |
50.00 9.90% |
35.00 9.41% |
64.00 4.79% |
353.00 7.97% |
163.00 13.98% |
177.00 6.91% |
255.00 8.81% |
205.00 9.77% |
| B/W Printer | 3168.00 41.17% |
2044.00 42.83% |
1076.00 38.68% |
2535.00 39.83% |
249.00 49.31% |
153.00 41.13% |
527.00 39.48% |
1845.00 41.65% |
504.00 43.22% |
620.00 24.20% |
1274.00 44.04% |
1226.00 58.41% |
| Color Copier | 110.00 1.43% |
66.00 1.38% |
39.00 1.40% |
96.00 1.51% |
5.00 0.99% |
4.00 1.08% |
15.00 1.12% |
64.00 1.44% |
21.00 1.80% |
23.00 0.90% |
49.00 1.69% |
33.00 1.57% |
| Color Printer | 3574.00 46.45% |
2208.00 46.27% |
1293.00 46.48% |
2951.00 46.36% |
205.00 40.59% |
232.00 62.37% |
587.00 43.97% |
2027.00 45.76% |
559.00 47.94% |
913.00 35.64% |
1561.00 53.96% |
1027.00 48.93% |
| Don t Know | 10.00 0.13% |
2.00 0.04% |
8.00 0.29% |
8.00 0.13% |
0.00 0.00% |
3.00 0.81% |
2.00 0.15% |
4.00 0.09% |
0.00 0.00% |
7.00 0.27% |
2.00 0.07% |
1.00 0.05% |
| Fax | 1836.00 23.86% |
1194.00 25.02% |
594.00 21.35% |
1439.00 22.61% |
147.00 29.11% |
92.00 24.73% |
226.00 16.93% |
1077.00 24.31% |
341.00 29.25% |
469.00 18.31% |
738.00 25.51% |
581.00 27.68% |
| Newton | 199.00 2.59% |
173.00 3.63% |
25.00 0.90% |
161.00 2.53% |
20.00 3.96% |
8.00 2.15% |
42.00 3.15% |
134.00 3.02% |
10.00 0.86% |
5.00 0.20% |
54.00 1.87% |
139.00 6.62% |
| None | 845.00 10.98% |
470.00 9.85% |
361.00 12.98% |
621.00 9.76% |
113.00 22.38% |
41.00 11.02% |
263.00 19.70% |
471.00 10.63% |
45.00 3.86% |
207.00 8.08% |
352.00 12.17% |
272.00 12.96% |
| Other PDA | 252.00 3.28% |
193.00 4.04% |
56.00 2.01% |
183.00 2.88% |
45.00 8.91% |
13.00 3.49% |
41.00 3.07% |
157.00 3.54% |
36.00 3.09% |
25.00 0.98% |
92.00 3.18% |
132.00 6.29% |
| Pilot | 187.00 2.43% |
137.00 2.87% |
47.00 1.69% |
153.00 2.40% |
11.00 2.18% |
4.00 1.08% |
43.00 3.22% |
122.00 2.75% |
13.00 1.11% |
14.00 0.55% |
58.00 2.00% |
112.00 5.34% |
| Scanner | 1625.00 21.12% |
1094.00 22.93% |
503.00 18.08% |
1316.00 20.68% |
121.00 23.96% |
58.00 15.59% |
229.00 17.15% |
1019.00 23.00% |
260.00 22.30% |
210.00 8.20% |
702.00 24.27% |
685.00 32.63% |
| Web TV | 2016.00 26.20% |
1258.00 26.36% |
726.00 26.10% |
1971.00 30.97% |
4.00 0.79% |
52.00 13.98% |
143.00 10.71% |
1132.00 25.55% |
517.00 44.34% |
1548.00 60.42% |
338.00 11.68% |
98.00 4.67% |


GVU's WWW Surveying Team
Graphics, Visualization, & Usability Center
College of Computing
Georgia Institute of Technology
Atlanta, GA 30332-0280