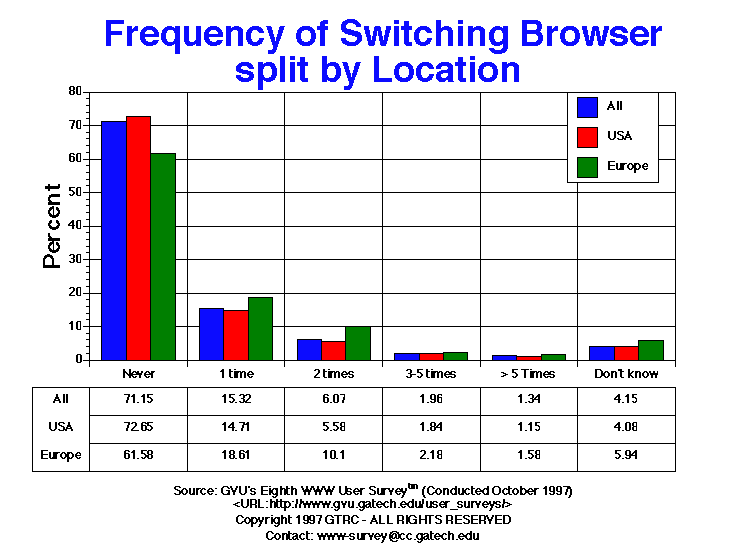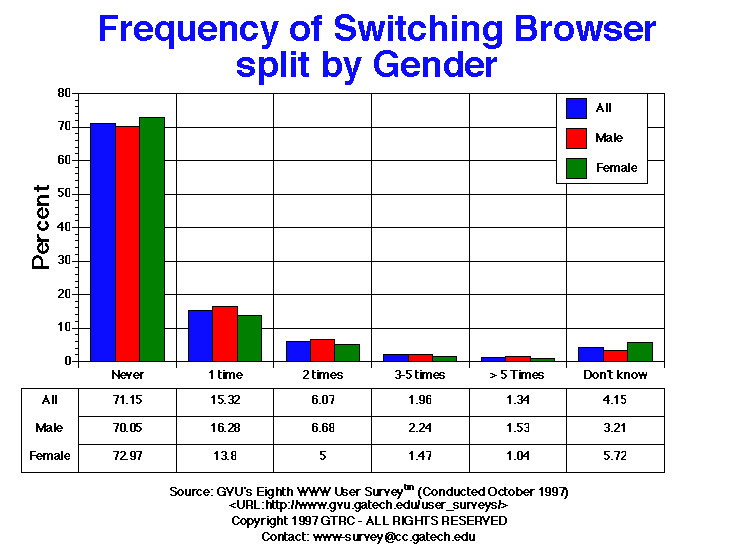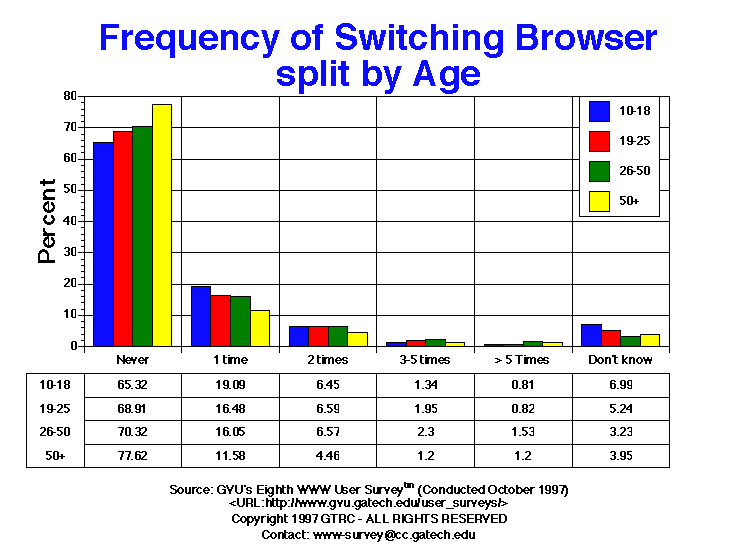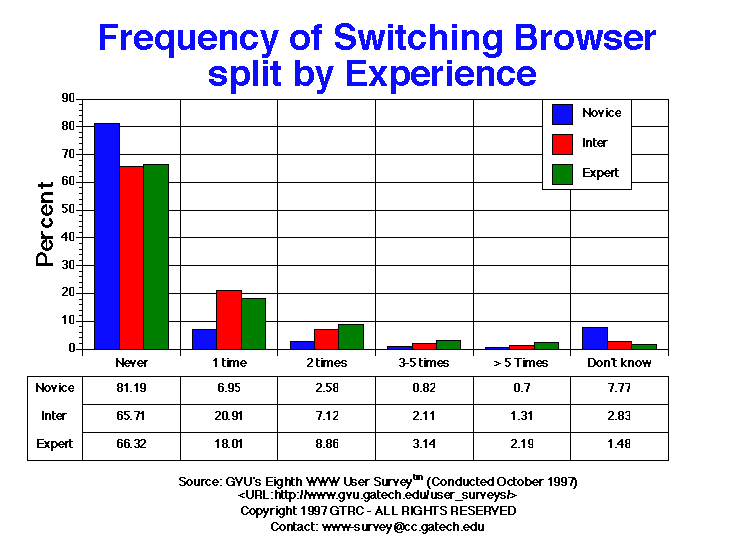

| Frequency of Switching Browsers | All | Male | Female | USA | Europe | 10-18 | 19-25 | 26-50 | 50+ | Novice | Intermediate | Expert |
| 1 time | 1179.00 15.32% |
777.00 16.28% |
384.00 13.80% |
936.00 14.71% |
94.00 18.61% |
71.00 19.09% |
220.00 16.48% |
711.00 16.05% |
135.00 11.58% |
178.00 6.95% |
605.00 20.91% |
378.00 18.01% |
| 2 times | 467.00 6.07% |
319.00 6.68% |
139.00 5.00% |
355.00 5.58% |
51.00 10.10% |
24.00 6.45% |
88.00 6.59% |
291.00 6.57% |
52.00 4.46% |
66.00 2.58% |
206.00 7.12% |
186.00 8.86% |
| 3-5 times | 151.00 1.96% |
107.00 2.24% |
41.00 1.47% |
117.00 1.84% |
11.00 2.18% |
5.00 1.34% |
26.00 1.95% |
102.00 2.30% |
14.00 1.20% |
21.00 0.82% |
61.00 2.11% |
66.00 3.14% |
| > 5 Times | 103.00 1.34% |
73.00 1.53% |
29.00 1.04% |
73.00 1.15% |
8.00 1.58% |
3.00 0.81% |
11.00 0.82% |
68.00 1.53% |
14.00 1.20% |
18.00 0.70% |
38.00 1.31% |
46.00 2.19% |
| Don't know | 319.00 4.15% |
153.00 3.21% |
159.00 5.72% |
260.00 4.08% |
30.00 5.94% |
26.00 6.99% |
70.00 5.24% |
143.00 3.23% |
46.00 3.95% |
199.00 7.77% |
82.00 2.83% |
31.00 1.48% |
| Never | 5474.00 71.15% |
3343.00 70.05% |
2030.00 72.97% |
4624.00 72.65% |
311.00 61.58% |
243.00 65.32% |
920.00 68.91% |
3115.00 70.32% |
905.00 77.62% |
2080.00 81.19% |
1901.00 65.71% |
1392.00 66.32% |


GVU's WWW Surveying Team
Graphics, Visualization, & Usability Center
College of Computing
Georgia Institute of Technology
Atlanta, GA 30332-0280