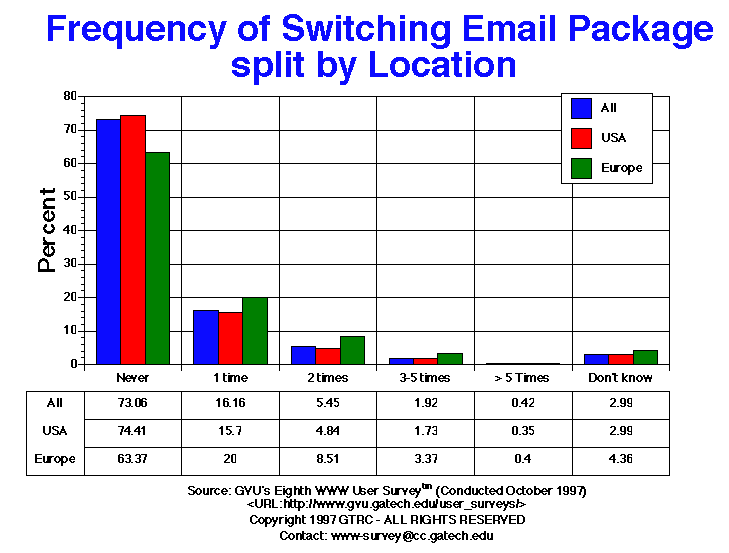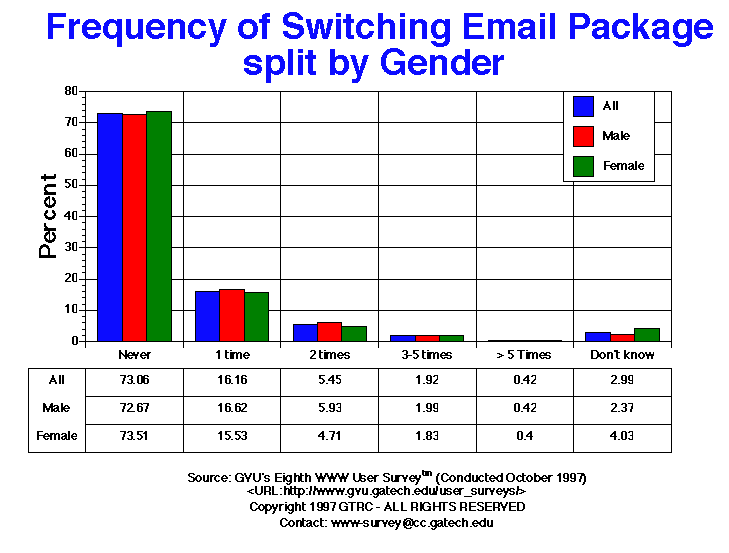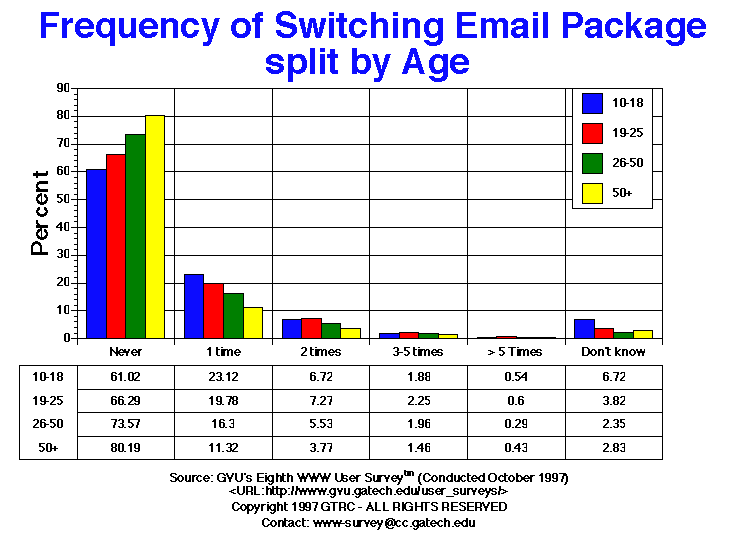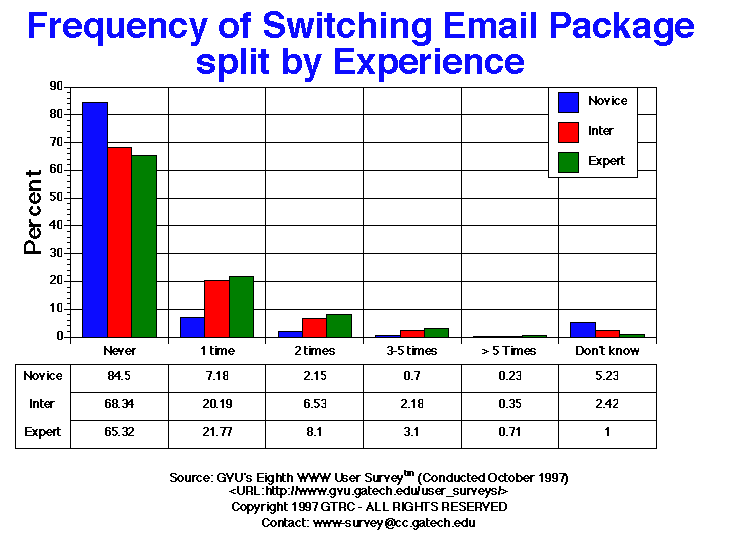

| Frequency of Switching Email Packages | All | Male | Female | USA | Europe | 10-18 | 19-25 | 26-50 | 50+ | Novice | Intermediate | Expert |
| 1 time | 1243.00 16.16% |
793.00 16.62% |
432.00 15.53% |
999.00 15.70% |
101.00 20.00% |
86.00 23.12% |
264.00 19.78% |
722.00 16.30% |
132.00 11.32% |
184.00 7.18% |
584.00 20.19% |
457.00 21.77% |
| 2 times | 419.00 5.45% |
283.00 5.93% |
131.00 4.71% |
308.00 4.84% |
43.00 8.51% |
25.00 6.72% |
97.00 7.27% |
245.00 5.53% |
44.00 3.77% |
55.00 2.15% |
189.00 6.53% |
170.00 8.10% |
| 3-5 times | 148.00 1.92% |
95.00 1.99% |
51.00 1.83% |
110.00 1.73% |
17.00 3.37% |
7.00 1.88% |
30.00 2.25% |
87.00 1.96% |
17.00 1.46% |
18.00 0.70% |
63.00 2.18% |
65.00 3.10% |
| > 5 Times | 32.00 0.42% |
20.00 0.42% |
11.00 0.40% |
22.00 0.35% |
2.00 0.40% |
2.00 0.54% |
8.00 0.60% |
13.00 0.29% |
5.00 0.43% |
6.00 0.23% |
10.00 0.35% |
15.00 0.71% |
| Don't know | 230.00 2.99% |
113.00 2.37% |
112.00 4.03% |
190.00 2.99% |
22.00 4.36% |
25.00 6.72% |
51.00 3.82% |
104.00 2.35% |
33.00 2.83% |
134.00 5.23% |
70.00 2.42% |
21.00 1.00% |
| Never | 5621.00 73.06% |
3468.00 72.67% |
2045.00 73.51% |
4736.00 74.41% |
320.00 63.37% |
227.00 61.02% |
885.00 66.29% |
3259.00 73.57% |
935.00 80.19% |
2165.00 84.50% |
1977.00 68.34% |
1371.00 65.32% |


GVU's WWW Surveying Team
Graphics, Visualization, & Usability Center
College of Computing
Georgia Institute of Technology
Atlanta, GA 30332-0280