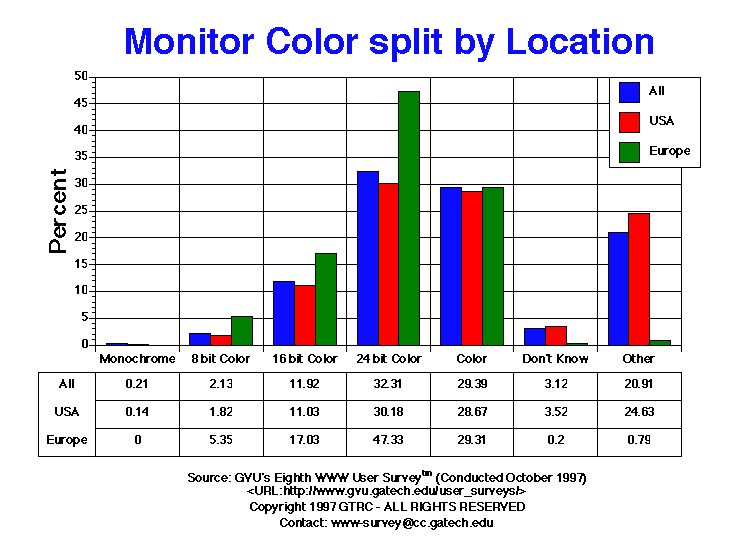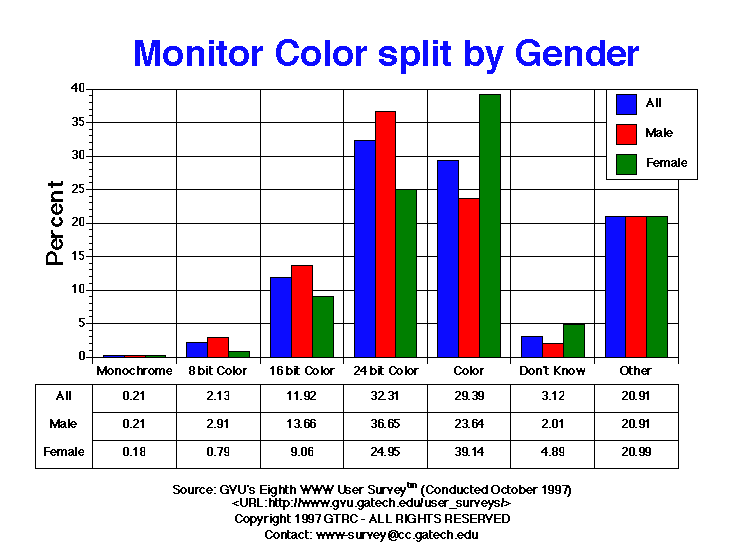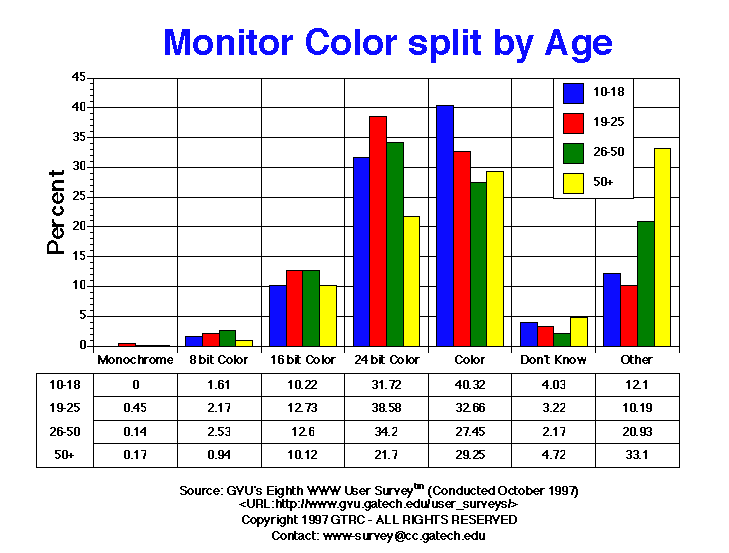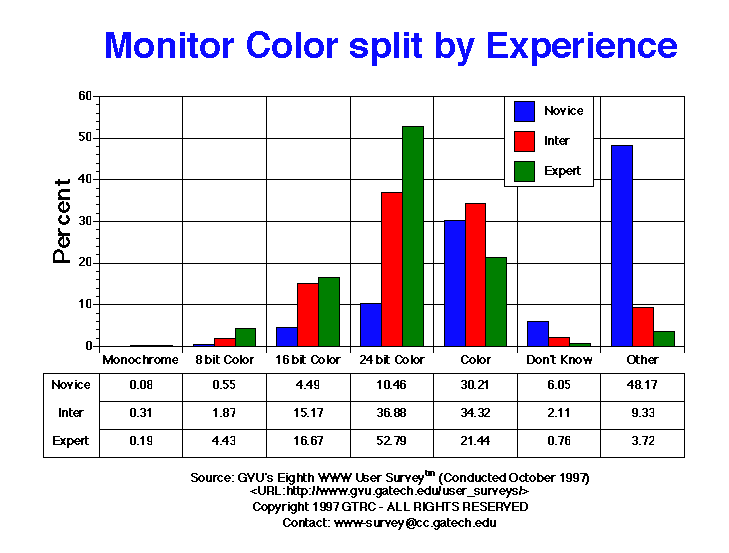

| Monitor Color Support | All | Male | Female | USA | Europe | 10-18 | 19-25 | 26-50 | 50+ | Novice | Intermediate | Expert |
| 16 bit Color | 917.00 11.92% |
652.00 13.66% |
252.00 9.06% |
702.00 11.03% |
86.00 17.03% |
38.00 10.22% |
170.00 12.73% |
558.00 12.60% |
118.00 10.12% |
115.00 4.49% |
439.00 15.17% |
350.00 16.67% |
| 24 bit Color | 2486.00 32.31% |
1749.00 36.65% |
694.00 24.95% |
1921.00 30.18% |
239.00 47.33% |
118.00 31.72% |
515.00 38.58% |
1515.00 34.20% |
253.00 21.70% |
268.00 10.46% |
1067.00 36.88% |
1108.00 52.79% |
| 8 bit Color | 164.00 2.13% |
139.00 2.91% |
22.00 0.79% |
116.00 1.82% |
27.00 5.35% |
6.00 1.61% |
29.00 2.17% |
112.00 2.53% |
11.00 0.94% |
14.00 0.55% |
54.00 1.87% |
93.00 4.43% |
| Color | 2261.00 29.39% |
1128.00 23.64% |
1089.00 39.14% |
1825.00 28.67% |
148.00 29.31% |
150.00 40.32% |
436.00 32.66% |
1216.00 27.45% |
341.00 29.25% |
774.00 30.21% |
993.00 34.32% |
450.00 21.44% |
| Don't Know | 240.00 3.12% |
96.00 2.01% |
136.00 4.89% |
224.00 3.52% |
1.00 0.20% |
15.00 4.03% |
43.00 3.22% |
96.00 2.17% |
55.00 4.72% |
155.00 6.05% |
61.00 2.11% |
16.00 0.76% |
| Monochrome | 16.00 0.21% |
10.00 0.21% |
5.00 0.18% |
9.00 0.14% |
0.00 0.00% |
0.00 0.00% |
6.00 0.45% |
6.00 0.14% |
2.00 0.17% |
2.00 0.08% |
9.00 0.31% |
4.00 0.19% |
| Other | 1609.00 20.91% |
998.00 20.91% |
584.00 20.99% |
1568.00 24.63% |
4.00 0.79% |
45.00 12.10% |
136.00 10.19% |
927.00 20.93% |
386.00 33.10% |
1234.00 48.17% |
270.00 9.33% |
78.00 3.72% |


GVU's WWW Surveying Team
Graphics, Visualization, & Usability Center
College of Computing
Georgia Institute of Technology
Atlanta, GA 30332-0280