
| Use of Internet Technologies | All | Male | Female | USA | Europe | 10-18 | 19-25 | 26-50 | 50+ | Novice | Intermediate | Expert |
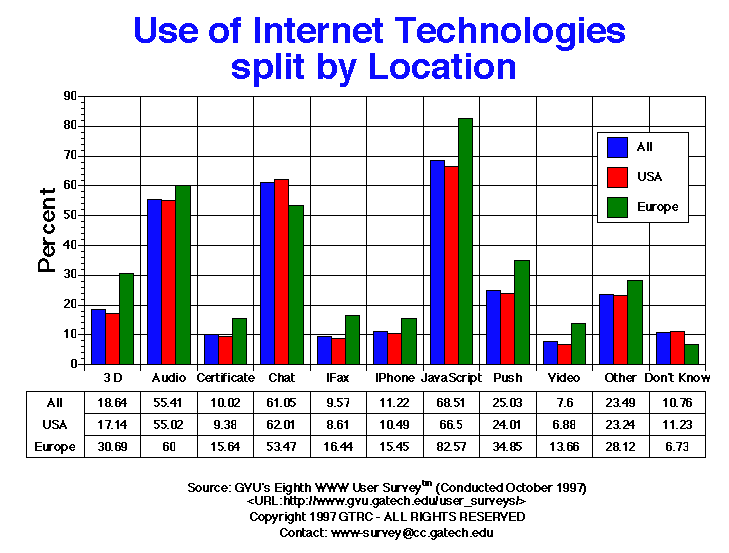
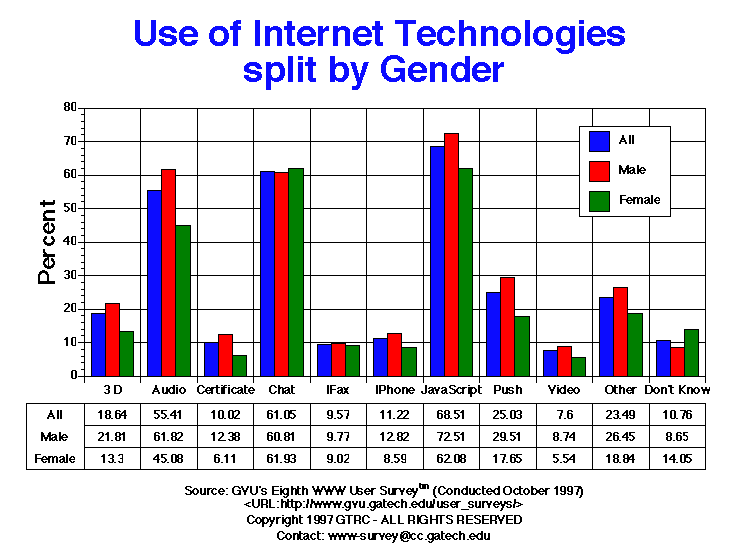
| 3 D | 1434.00 18.64% |
1041.00 21.81% |
370.00 13.30% |
1091.00 17.14% |
155.00 30.69% |
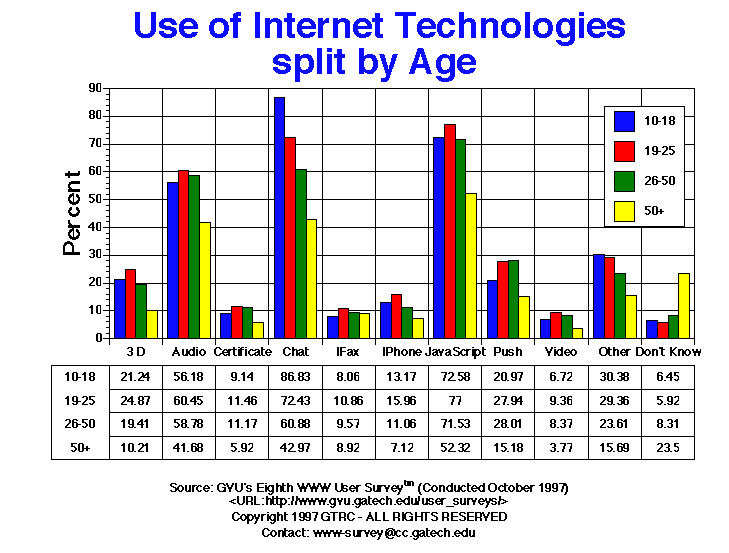
79.00 21.24% |
332.00 24.87% |
860.00 19.41% |
119.00 10.21% |
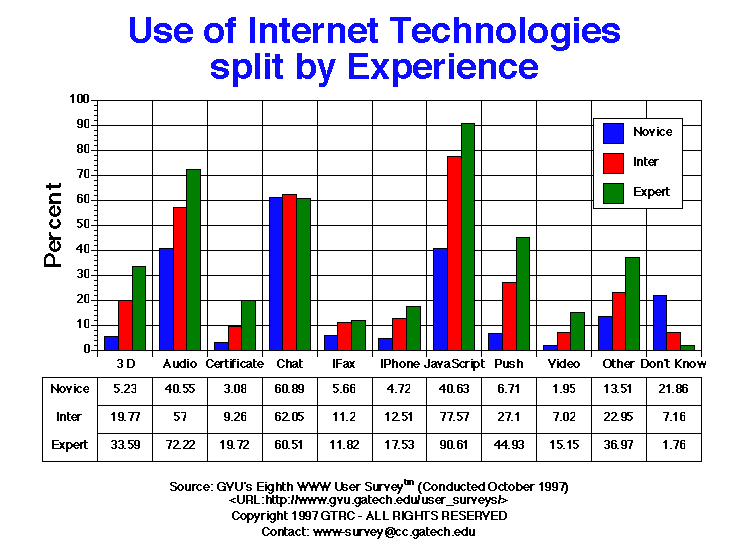
134.00 5.23% |
572.00 19.77% |
705.00 33.59% |
| Audio | 4263.00 55.41% |
2950.00 61.82% |
1254.00 45.08% |
3502.00 55.02% |
303.00 60.00% |
209.00 56.18% |
807.00 60.45% |
2604.00 58.78% |
486.00 41.68% |
1039.00 40.55% |
1649.00 57.00% |
1516.00 72.22% |
| Certificate | 771.00 10.02% |
591.00 12.38% |
170.00 6.11% |
597.00 9.38% |
79.00 15.64% |
34.00 9.14% |
153.00 11.46% |
495.00 11.17% |
69.00 5.92% |
79.00 3.08% |
268.00 9.26% |
414.00 19.72% |
| Chat | 4697.00 61.05% |
2902.00 60.81% |
1723.00 61.93% |
3947.00 62.01% |
270.00 53.47% |
323.00 86.83% |
967.00 72.43% |
2697.00 60.88% |
501.00 42.97% |
1560.00 60.89% |
1795.00 62.05% |
1270.00 60.51% |
| Don t Know | 828.00 10.76% |
413.00 8.65% |
391.00 14.05% |
715.00 11.23% |
34.00 6.73% |
24.00 6.45% |
79.00 5.92% |
368.00 8.31% |
274.00 23.50% |
560.00 21.86% |
207.00 7.16% |
37.00 1.76% |
| IFax | 736.00 9.57% |
466.00 9.77% |
251.00 9.02% |
548.00 8.61% |
83.00 16.44% |
30.00 8.06% |
145.00 10.86% |
424.00 9.57% |
104.00 8.92% |
145.00 5.66% |
324.00 11.20% |
248.00 11.82% |
| IPhone | 863.00 11.22% |
612.00 12.82% |
239.00 8.59% |
668.00 10.49% |
78.00 15.45% |
49.00 13.17% |
213.00 15.96% |
490.00 11.06% |
83.00 7.12% |
121.00 4.72% |
362.00 12.51% |
368.00 17.53% |
| Java Script | 5271.00 68.51% |
3460.00 72.51% |
1727.00 62.08% |
4233.00 66.50% |
417.00 82.57% |
270.00 72.58% |
1028.00 77.00% |
3169.00 71.53% |
610.00 52.32% |
1041.00 40.63% |
2244.00 77.57% |
1902.00 90.61% |
| Other | 1807.00 23.49% |
1262.00 26.45% |
524.00 18.84% |
1479.00 23.24% |
142.00 28.12% |
113.00 30.38% |
392.00 29.36% |
1046.00 23.61% |
183.00 15.69% |
346.00 13.51% |
664.00 22.95% |
776.00 36.97% |
| No, think | 1.00 0.01% |
0.00 0.00% |
0.00 0.00% |
0.00 0.00% |
0.00 0.00% |
0.00 0.00% |
0.00 0.00% |
0.00 0.00% |
0.00 0.00% |
0.00 0.00% |
0.00 0.00% |
0.00 0.00% |
| Push | 1926.00 25.03% |
1408.00 29.51% |
491.00 17.65% |
1528.00 24.01% |
176.00 34.85% |
78.00 20.97% |
373.00 27.94% |
1241.00 28.01% |
177.00 15.18% |
172.00 6.71% |
784.00 27.10% |
943.00 44.93% |
| Video | 585.00 7.60% |
417.00 8.74% |
154.00 5.54% |
438.00 6.88% |
69.00 13.66% |
25.00 6.72% |
125.00 9.36% |
371.00 8.37% |
44.00 3.77% |
50.00 1.95% |
203.00 7.02% |
318.00 15.15% |


GVU's WWW Surveying Team
Graphics, Visualization, & Usability Center
College of Computing
Georgia Institute of Technology
Atlanta, GA 30332-0280