
| Using Current Browser Version | All | Male | Female | USA | Europe | 10-18 | 19-25 | 26-50 | 50+ | Novice | Intermediate | Expert |
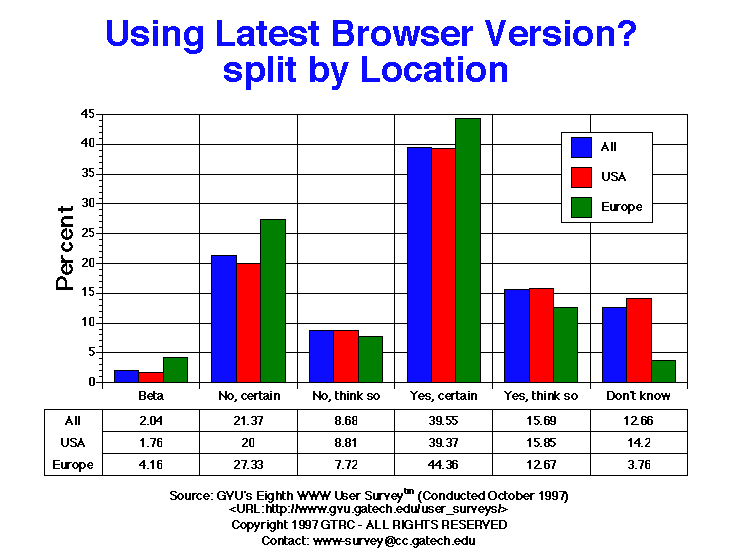
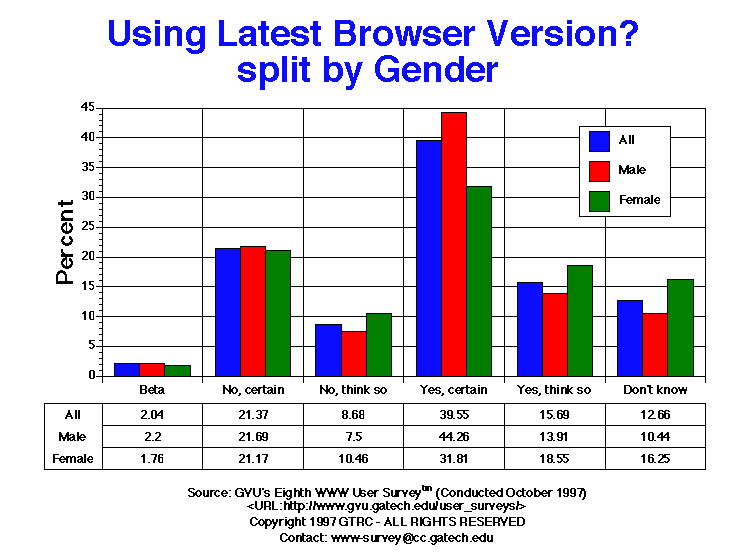
| Beta | 157.00 2.04% |
105.00 2.20% |
49.00 1.76% |
112.00 1.76% |
21.00 4.16% |
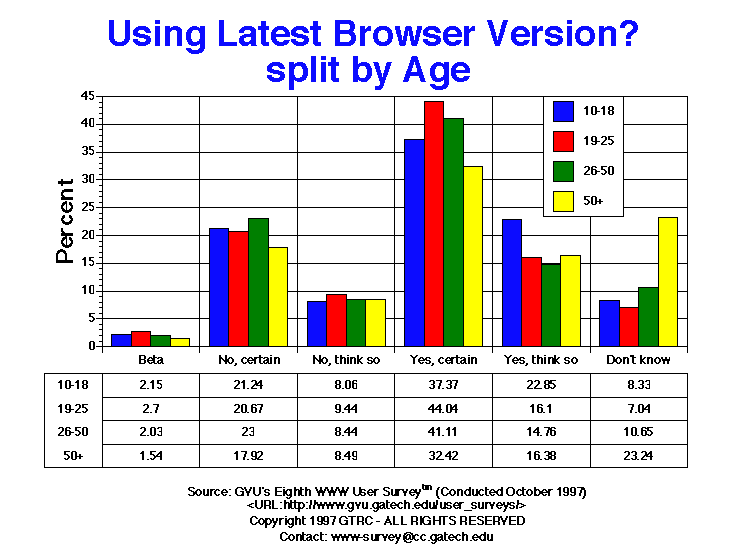
8.00 2.15% |
36.00 2.70% |
90.00 2.03% |
18.00 1.54% |
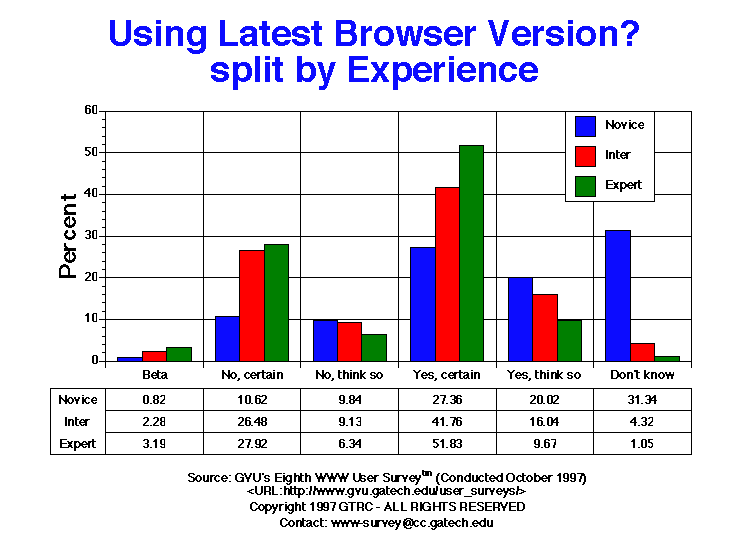
21.00 0.82% |
66.00 2.28% |
67.00 3.19% |
| Don't know | 974.00 12.66% |
498.00 10.44% |
452.00 16.25% |
904.00 14.20% |
19.00 3.76% |
31.00 8.33% |
94.00 7.04% |
472.00 10.65% |
271.00 23.24% |
803.00 31.34% |
125.00 4.32% |
22.00 1.05% |
| No, certain | 1644.00 21.37% |
1035.00 21.69% |
589.00 21.17% |
1273.00 20.00% |
138.00 27.33% |
79.00 21.24% |
276.00 20.67% |
1019.00 23.00% |
209.00 17.92% |
272.00 10.62% |
766.00 26.48% |
586.00 27.92% |
| No, think | 668.00 8.68% |
358.00 7.50% |
291.00 10.46% |
561.00 8.81% |
39.00 7.72% |
30.00 8.06% |
126.00 9.44% |
374.00 8.44% |
99.00 8.49% |
252.00 9.84% |
264.00 9.13% |
133.00 6.34% |
| Yes, certain | 3043.00 39.55% |
2112.00 44.26% |
885.00 31.81% |
2506.00 39.37% |
224.00 44.36% |
139.00 37.37% |
588.00 44.04% |
1821.00 41.11% |
378.00 32.42% |
701.00 27.36% |
1208.00 41.76% |
1088.00 51.83% |
| Yes, think so | 1207.00 15.69% |
664.00 13.91% |
516.00 18.55% |
1009.00 15.85% |
64.00 12.67% |
85.00 22.85% |
215.00 16.10% |
654.00 14.76% |
191.00 16.38% |
513.00 20.02% |
464.00 16.04% |
203.00 9.67% |


GVU's WWW Surveying Team
Graphics, Visualization, & Usability Center
College of Computing
Georgia Institute of Technology
Atlanta, GA 30332-0280