
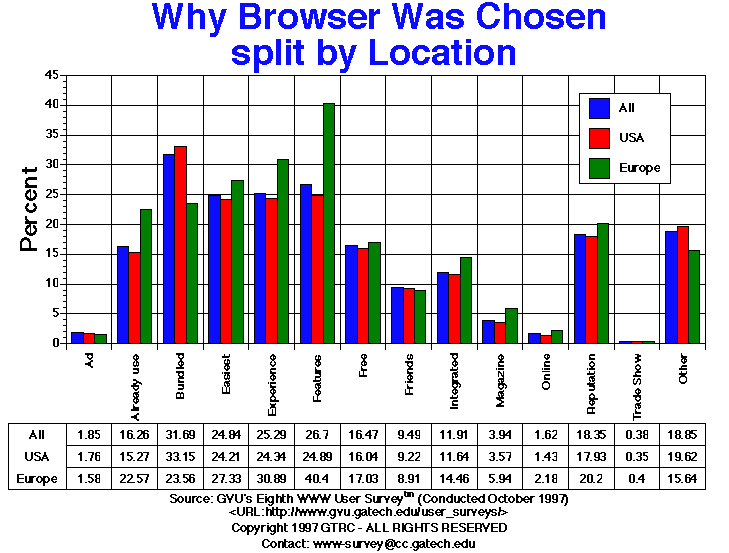
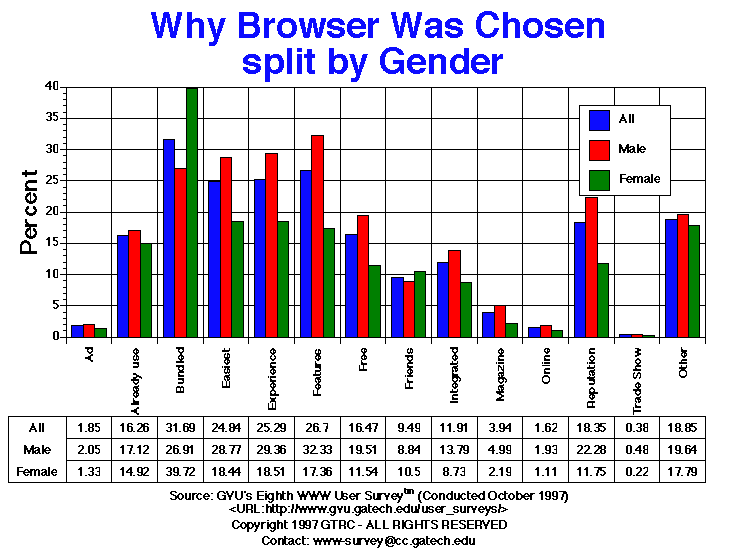
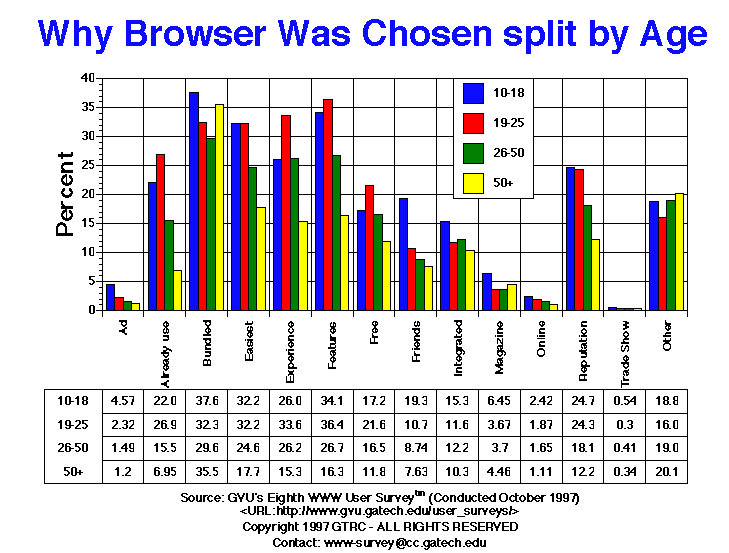
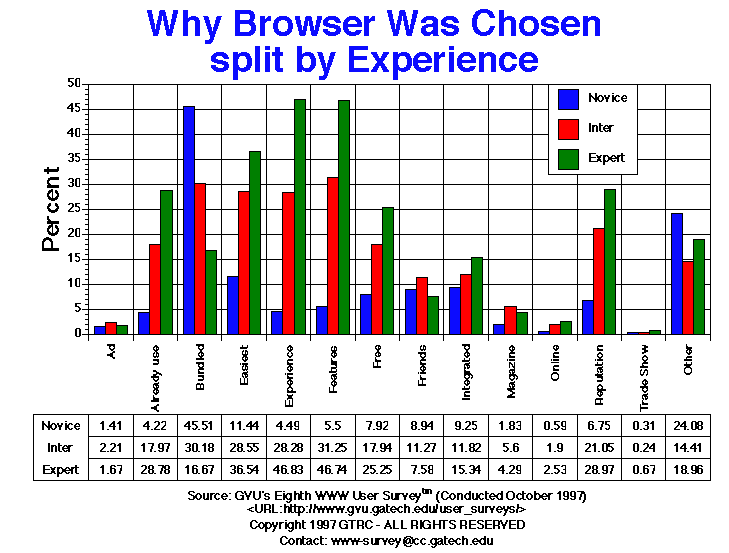
| Why Browser Was Chosen | All | Male | Female | USA | Europe | 10-18 | 19-25 | 26-50 | 50+ | Novice | Intermediate | Expert |
| Ad | 142.00 1.85% |
98.00 2.05% |
37.00 1.33% |
112.00 1.76% |
8.00 1.58% |
17.00 4.57% |
31.00 2.32% |
66.00 1.49% |
14.00 1.20% |
36.00 1.41% |
64.00 2.21% |
35.00 1.67% |
| Already use | 1251.00 16.26% |
817.00 17.12% |
415.00 14.92% |
972.00 15.27% |
114.00 22.57% |
82.00 22.04% |
360.00 26.97% |
689.00 15.55% |
81.00 6.95% |
108.00 4.22% |
520.00 17.97% |
604.00 28.78% |
| Bundled | 2438.00 31.69% |
1284.00 26.91% |
1105.00 39.72% |
2110.00 33.15% |
119.00 23.56% |
140.00 37.63% |
432.00 32.36% |
1312.00 29.62% |
414.00 35.51% |
1166.00 45.51% |
873.00 30.18% |
350.00 16.67% |
| Easiest | 1911.00 24.84% |
1373.00 28.77% |
513.00 18.44% |
1541.00 24.21% |
138.00 27.33% |
120.00 32.26% |
431.00 32.28% |
1092.00 24.65% |
207.00 17.75% |
293.00 11.44% |
826.00 28.55% |
767.00 36.54% |
| Experience | 1946.00 25.29% |
1401.00 29.36% |
515.00 18.51% |
1549.00 24.34% |
156.00 30.89% |
97.00 26.08% |
449.00 33.63% |
1163.00 26.25% |
179.00 15.35% |
115.00 4.49% |
818.00 28.28% |
983.00 46.83% |
| Features | 2054.00 26.70% |
1543.00 32.33% |
483.00 17.36% |
1584.00 24.89% |
204.00 40.40% |
127.00 34.14% |
487.00 36.48% |
1186.00 26.77% |
191.00 16.38% |
141.00 5.50% |
904.00 31.25% |
981.00 46.74% |
| Free | 1267.00 16.47% |
931.00 19.51% |
321.00 11.54% |
1021.00 16.04% |
86.00 17.03% |
64.00 17.20% |
289.00 21.65% |
735.00 16.59% |
138.00 11.84% |
203.00 7.92% |
519.00 17.94% |
530.00 25.25% |
| Friends | 730.00 9.49% |
422.00 8.84% |
292.00 10.50% |
587.00 9.22% |
45.00 8.91% |
72.00 19.35% |
144.00 10.79% |
387.00 8.74% |
89.00 7.63% |
229.00 8.94% |
326.00 11.27% |
159.00 7.58% |
| Integrated | 916.00 11.91% |
658.00 13.79% |
243.00 8.73% |
741.00 11.64% |
73.00 14.46% |
57.00 15.32% |
156.00 11.69% |
542.00 12.23% |
121.00 10.38% |
237.00 9.25% |
342.00 11.82% |
322.00 15.34% |
| Magazine | 303.00 3.94% |
238.00 4.99% |
61.00 2.19% |
227.00 3.57% |
30.00 5.94% |
24.00 6.45% |
49.00 3.67% |
164.00 3.70% |
52.00 4.46% |
47.00 1.83% |
162.00 5.60% |
90.00 4.29% |
| Online | 125.00 1.62% |
92.00 1.93% |
31.00 1.11% |
91.00 1.43% |
11.00 2.18% |
9.00 2.42% |
25.00 1.87% |
73.00 1.65% |
13.00 1.11% |
15.00 0.59% |
55.00 1.90% |
53.00 2.53% |
| Other | 1450.00 18.85% |
937.00 19.64% |
495.00 17.79% |
1249.00 19.62% |
79.00 15.64% |
70.00 18.82% |
214.00 16.03% |
843.00 19.03% |
235.00 20.15% |
617.00 24.08% |
417.00 14.41% |
398.00 18.96% |
| Reputation | 1412.00 18.35% |
1063.00 22.28% |
327.00 11.75% |
1141.00 17.93% |
102.00 20.20% |
92.00 24.73% |
325.00 24.34% |
805.00 18.17% |
143.00 12.26% |
173.00 6.75% |
609.00 21.05% |
608.00 28.97% |
| Trade Show | 29.00 0.38% |
23.00 0.48% |
6.00 0.22% |
22.00 0.35% |
2.00 0.40% |
2.00 0.54% |
4.00 0.30% |
18.00 0.41% |
4.00 0.34% |
8.00 0.31% |
7.00 0.24% |
14.00 0.67% |
GVU's WWW Surveying Team
Graphics, Visualization, & Usability Center
College of Computing
Georgia Institute of Technology
Atlanta, GA 30332-0280