
| Chat groups | All | Male | Female | USA | Europe | 10-18 | 19-25 | 26-50 | 50+ | Novice | Intermediate | Expert |
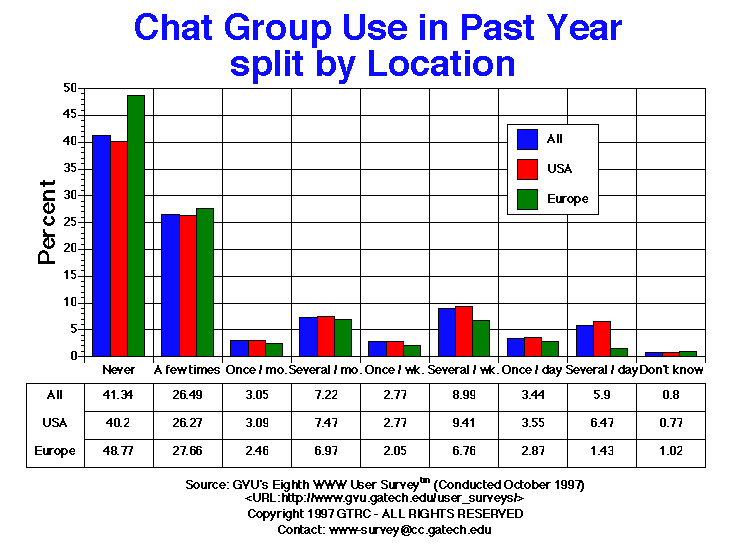
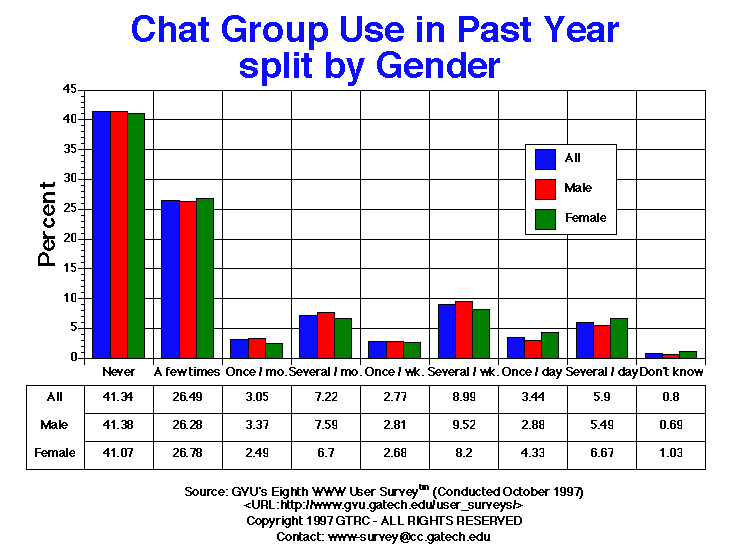
| A few times | 1912.00 26.49% |
1187.00 26.28% |
699.00 26.78% |
1575.00 26.27% |
135.00 27.66% |
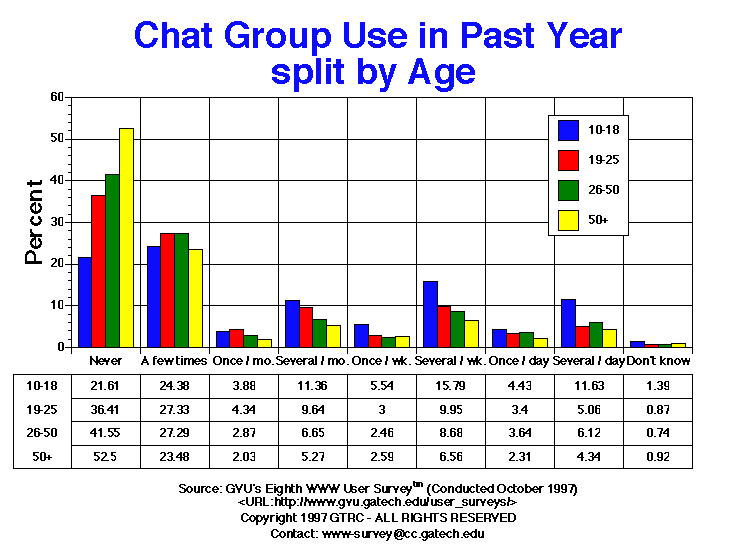
88.00 24.38% |
346.00 27.33% |
1141.00 27.29% |
254.00 23.48% |
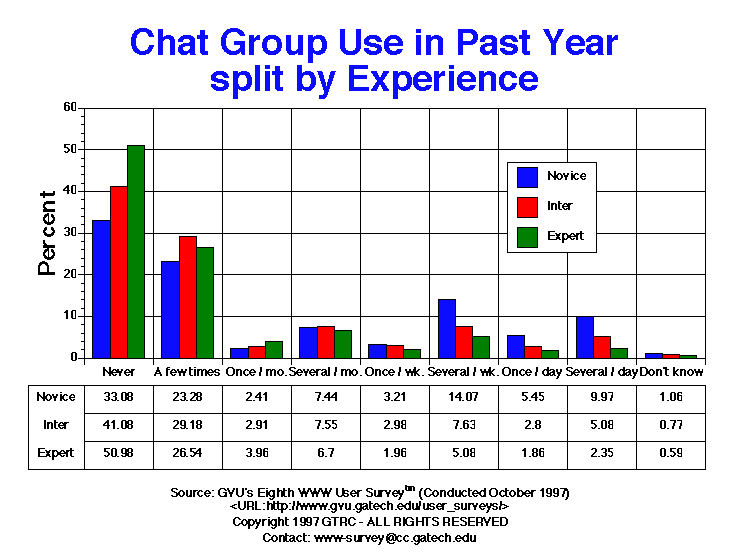
551.00 23.28% |
792.00 29.18% |
543.00 26.54% |
| Don't know | 58.00 0.80% |
31.00 0.69% |
27.00 1.03% |
46.00 0.77% |
5.00 1.02% |
5.00 1.39% |
11.00 0.87% |
31.00 0.74% |
10.00 0.92% |
25.00 1.06% |
21.00 0.77% |
12.00 0.59% |
| Never | 2984.00 41.34% |
1869.00 41.38% |
1072.00 41.07% |
2410.00 40.20% |
238.00 48.77% |
78.00 21.61% |
461.00 36.41% |
1737.00 41.55% |
568.00 52.50% |
783.00 33.08% |
1115.00 41.08% |
1043.00 50.98% |
| Once per day | 248.00 3.44% |
130.00 2.88% |
113.00 4.33% |
213.00 3.55% |
14.00 2.87% |
16.00 4.43% |
43.00 3.40% |
152.00 3.64% |
25.00 2.31% |
129.00 5.45% |
76.00 2.80% |
38.00 1.86% |
| Once per month | 220.00 3.05% |
152.00 3.37% |
65.00 2.49% |
185.00 3.09% |
12.00 2.46% |
14.00 3.88% |
55.00 4.34% |
120.00 2.87% |
22.00 2.03% |
57.00 2.41% |
79.00 2.91% |
81.00 3.96% |
| Once per week | 200.00 2.77% |
127.00 2.81% |
70.00 2.68% |
166.00 2.77% |
10.00 2.05% |
20.00 5.54% |
38.00 3.00% |
103.00 2.46% |
28.00 2.59% |
76.00 3.21% |
81.00 2.98% |
40.00 1.96% |
| Several | 1.00 0.01% |
0.00 0.00% |
1.00 0.04% |
0.00 0.00% |
0.00 0.00% |
0.00 0.00% |
0.00 0.00% |
0.00 0.00% |
0.00 0.00% |
1.00 0.04% |
0.00 0.00% |
0.00 0.00% |
| Several times per day | 426.00 5.90% |
248.00 5.49% |
174.00 6.67% |
388.00 6.47% |
7.00 1.43% |
42.00 11.63% |
64.00 5.06% |
256.00 6.12% |
47.00 4.34% |
236.00 9.97% |
138.00 5.08% |
48.00 2.35% |
| Several times per month | 521.00 7.22% |
343.00 7.59% |
175.00 6.70% |
448.00 7.47% |
34.00 6.97% |
41.00 11.36% |
122.00 9.64% |
278.00 6.65% |
57.00 5.27% |
176.00 7.44% |
205.00 7.55% |
137.00 6.70% |
| Several times per week | 649.00 8.99% |
430.00 9.52% |
214.00 8.20% |
564.00 9.41% |
33.00 6.76% |
57.00 15.79% |
126.00 9.95% |
363.00 8.68% |
71.00 6.56% |
333.00 14.07% |
207.00 7.63% |
104.00 5.08% |


GVU's WWW Surveying Team
Graphics, Visualization, & Usability Center
College of Computing
Georgia Institute of Technology
Atlanta, GA 30332-0280