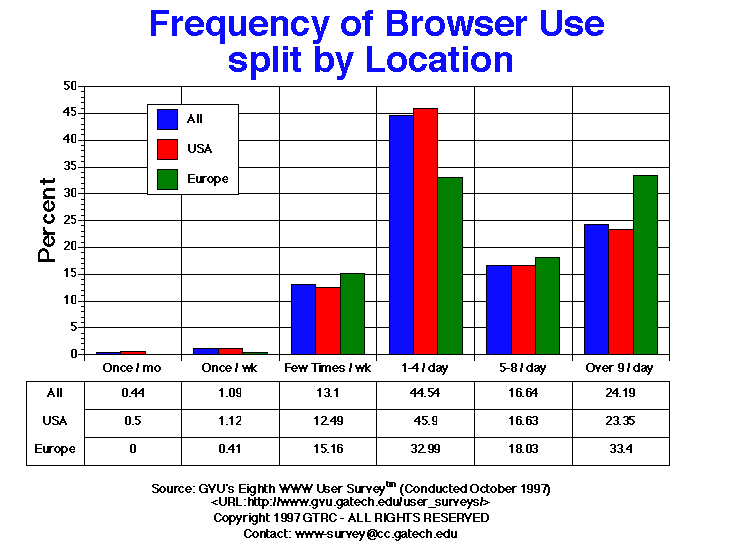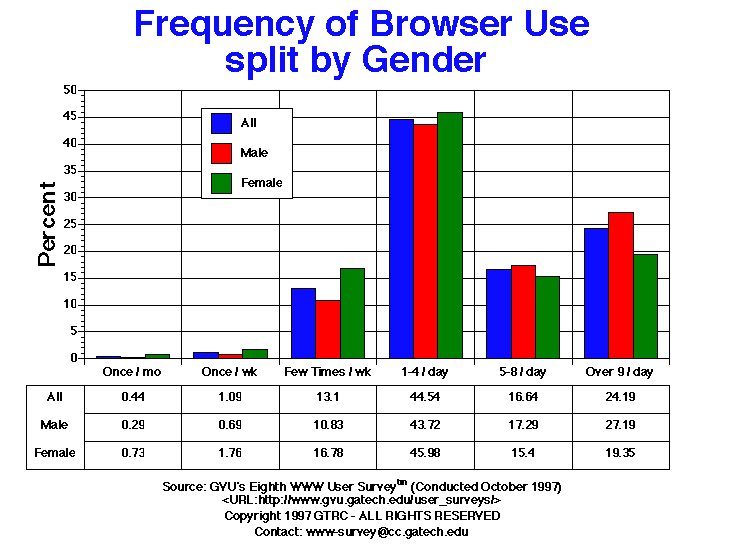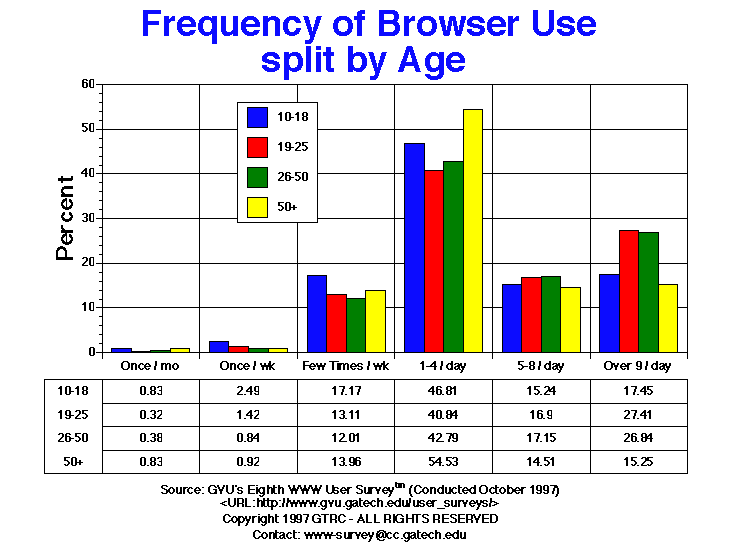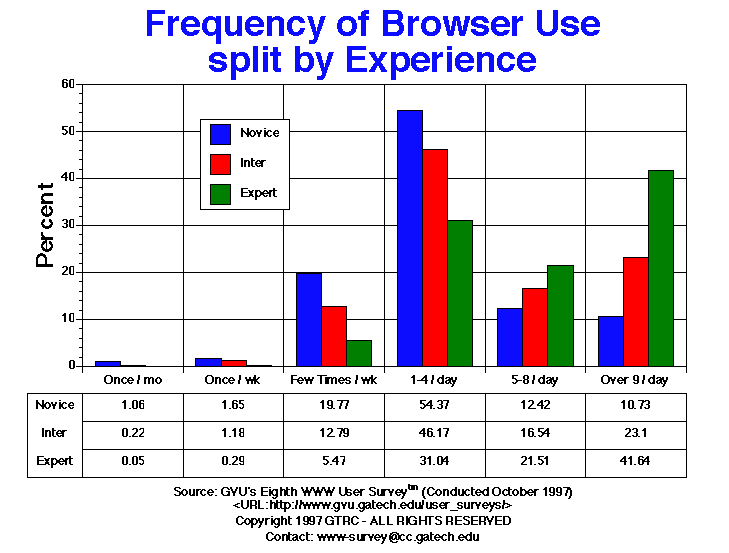

| Frequency of Use | All | Male | Female | USA | Europe | 10-18 | 19-25 | 26-50 | 50+ | Novice | Intermediate | Expert |
| 1-4/dy | 3215.00 44.54% |
1975.00 43.72% |
1200.00 45.98% |
2752.00 45.90% |
161.00 32.99% |
169.00 46.81% |
517.00 40.84% |
1789.00 42.79% |
590.00 54.53% |
1287.00 54.37% |
1253.00 46.17% |
635.00 31.04% |
| 5-8/dy | 1201.00 16.64% |
781.00 17.29% |
402.00 15.40% |
997.00 16.63% |
88.00 18.03% |
55.00 15.24% |
214.00 16.90% |
717.00 17.15% |
157.00 14.51% |
294.00 12.42% |
449.00 16.54% |
440.00 21.51% |
| Few Times/wk | 946.00 13.10% |
489.00 10.83% |
438.00 16.78% |
749.00 12.49% |
74.00 15.16% |
62.00 17.17% |
166.00 13.11% |
502.00 12.01% |
151.00 13.96% |
468.00 19.77% |
347.00 12.79% |
112.00 5.47% |
| Once/mo | 32.00 0.44% |
13.00 0.29% |
19.00 0.73% |
30.00 0.50% |
0.00 0.00% |
3.00 0.83% |
4.00 0.32% |
16.00 0.38% |
9.00 0.83% |
25.00 1.06% |
6.00 0.22% |
1.00 0.05% |
| Once/wk | 79.00 1.09% |
31.00 0.69% |
46.00 1.76% |
67.00 1.12% |
2.00 0.41% |
9.00 2.49% |
18.00 1.42% |
35.00 0.84% |
10.00 0.92% |
39.00 1.65% |
32.00 1.18% |
6.00 0.29% |
| Over 9/dy | 1746.00 24.19% |
1228.00 27.19% |
505.00 19.35% |
1400.00 23.35% |
163.00 33.40% |
63.00 17.45% |
347.00 27.41% |
1122.00 26.84% |
165.00 15.25% |
254.00 10.73% |
627.00 23.10% |
852.00 41.64% |


GVU's WWW Surveying Team
Graphics, Visualization, & Usability Center
College of Computing
Georgia Institute of Technology
Atlanta, GA 30332-0280