
| Fun | All | Male | Female | USA | Europe | 10-18 | 19-25 | 26-50 | 50+ | Novice | Intermediate | Expert |
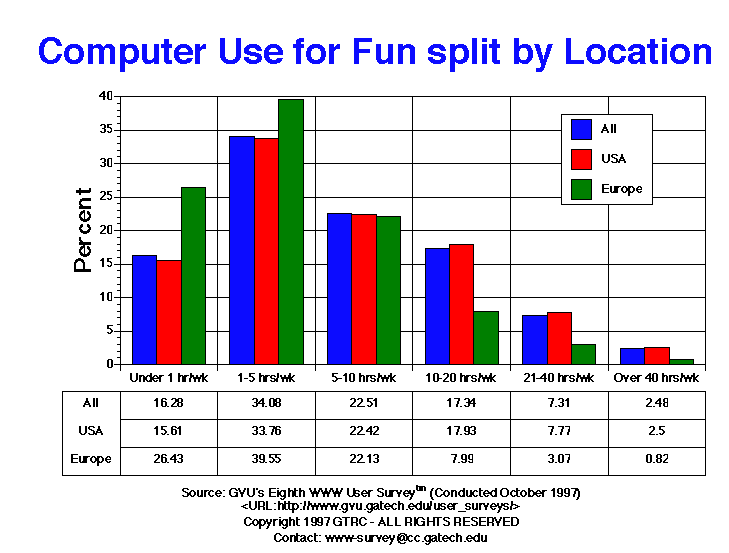
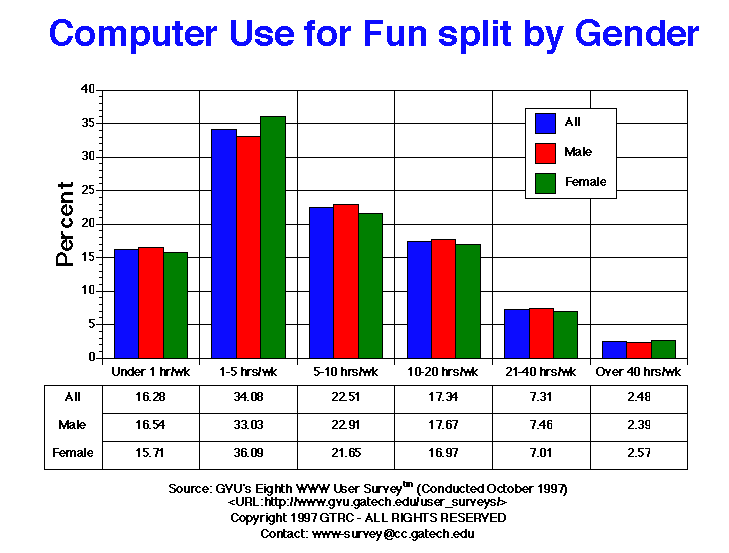
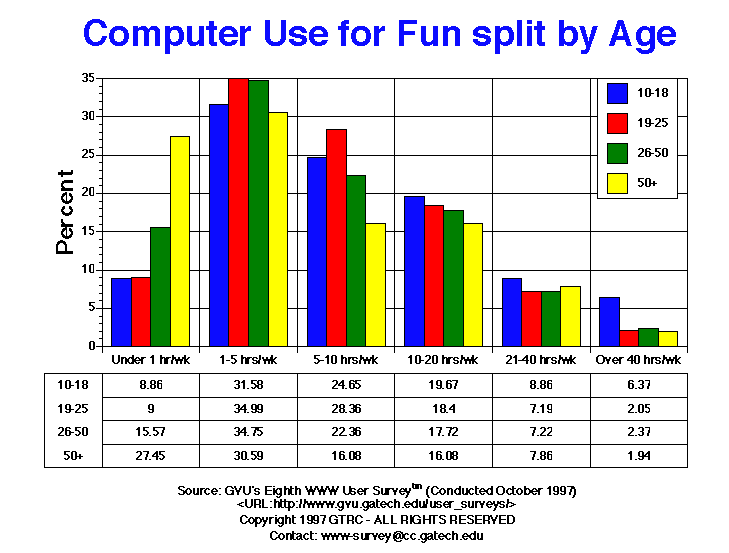
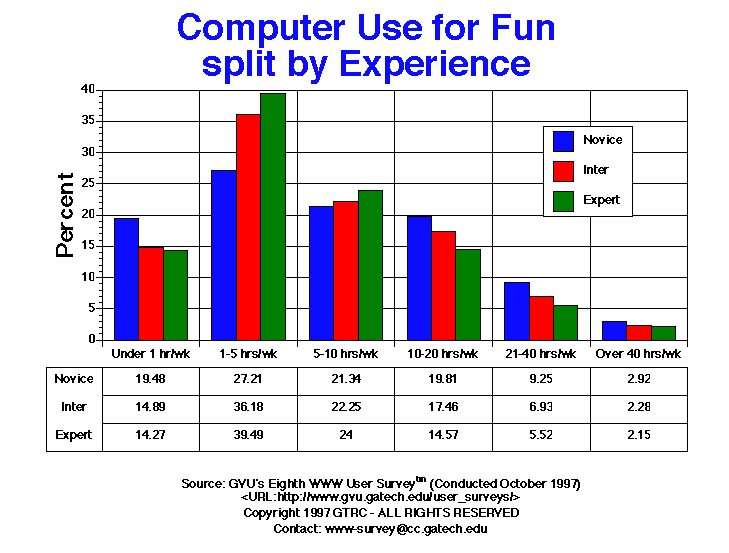
| 1-5 hrs | 2460.00 34.08% |
1492.00 33.03% |
942.00 36.09% |
2024.00 33.76% |
193.00 39.55% |
114.00 31.58% |
443.00 34.99% |
1453.00 34.75% |
331.00 30.59% |
644.00 27.21% |
982.00 36.18% |
808.00 39.49% |
| 10-20 hrs | 1252.00 17.34% |
798.00 17.67% |
443.00 16.97% |
1075.00 17.93% |
39.00 7.99% |
71.00 19.67% |
233.00 18.40% |
741.00 17.72% |
174.00 16.08% |
469.00 19.81% |
474.00 17.46% |
298.00 14.57% |
| 21-40 | 528.00 7.31% |
337.00 7.46% |
183.00 7.01% |
466.00 7.77% |
15.00 3.07% |
32.00 8.86% |
91.00 7.19% |
302.00 7.22% |
85.00 7.86% |
219.00 9.25% |
188.00 6.93% |
113.00 5.52% |
| 5-10 hrs | 1625.00 22.51% |
1035.00 22.91% |
565.00 21.65% |
1344.00 22.42% |
108.00 22.13% |
89.00 24.65% |
359.00 28.36% |
935.00 22.36% |
174.00 16.08% |
505.00 21.34% |
604.00 22.25% |
491.00 24.00% |
| Over 40 | 179.00 2.48% |
108.00 2.39% |
67.00 2.57% |
150.00 2.50% |
4.00 0.82% |
23.00 6.37% |
26.00 2.05% |
99.00 2.37% |
21.00 1.94% |
69.00 2.92% |
62.00 2.28% |
44.00 2.15% |
| Under 1 hr | 1175.00 16.28% |
747.00 16.54% |
410.00 15.71% |
936.00 15.61% |
129.00 26.43% |
32.00 8.86% |
114.00 9.00% |
651.00 15.57% |
297.00 27.45% |
461.00 19.48% |
404.00 14.89% |
292.00 14.27% |
GVU's WWW Surveying Team
Graphics, Visualization, & Usability Center
College of Computing
Georgia Institute of Technology
Atlanta, GA 30332-0280