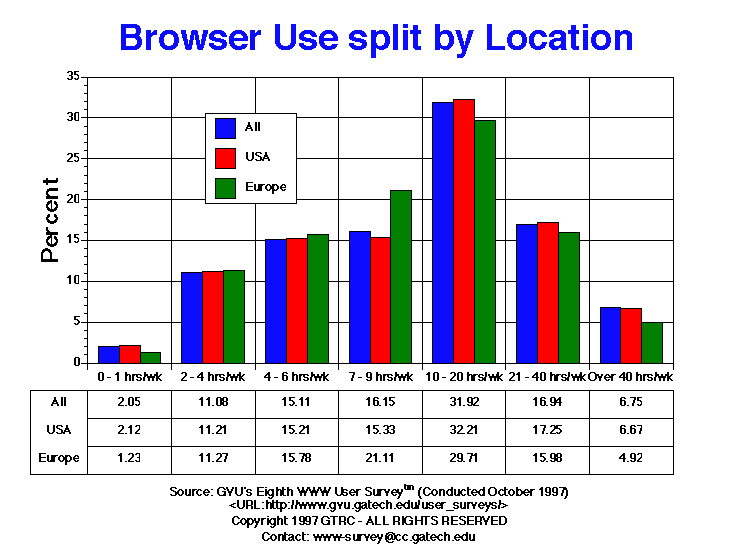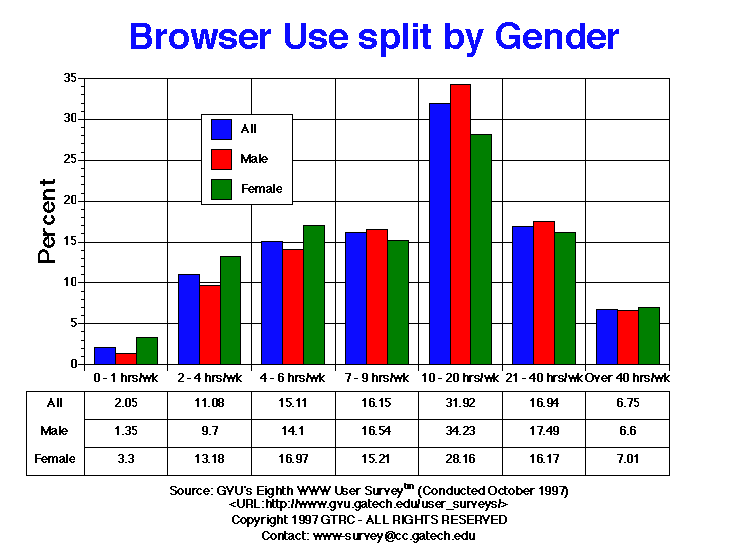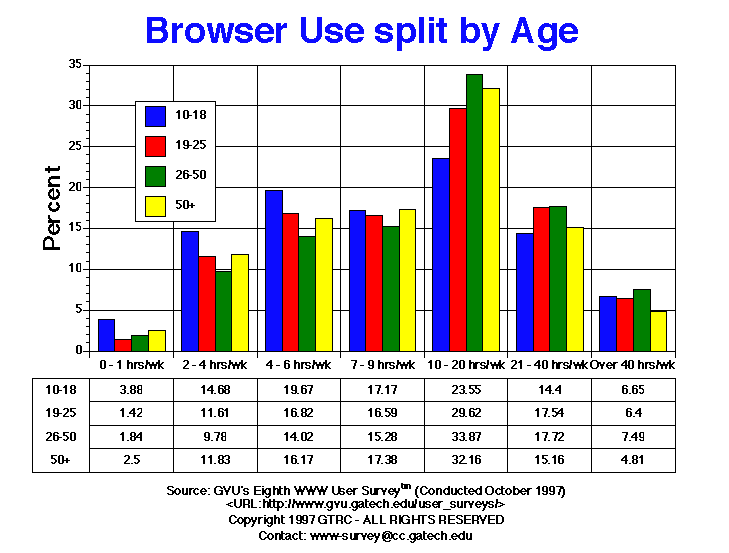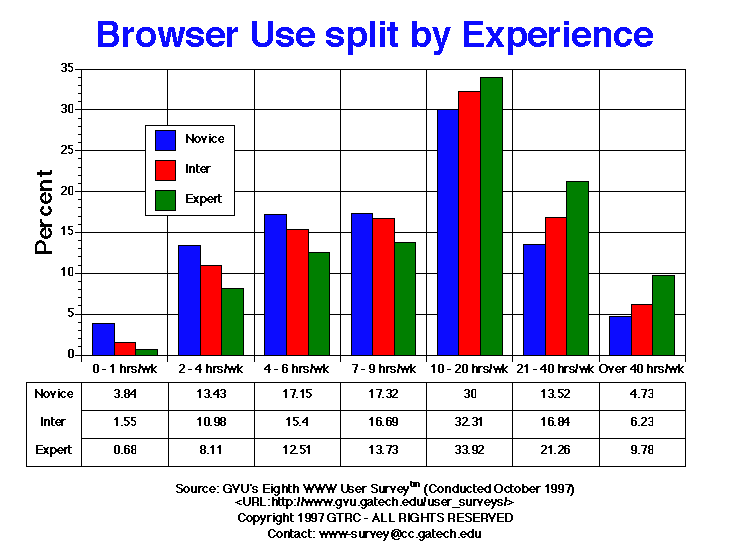

| Hours Used | All | Male | Female | USA | Europe | 10-18 | 19-25 | 26-50 | 50+ | Novice | Intermediate | Expert |
| 0-1 | 148.00 2.05% |
61.00 1.35% |
86.00 3.30% |
127.00 2.12% |
6.00 1.23% |
14.00 3.88% |
18.00 1.42% |
77.00 1.84% |
27.00 2.50% |
91.00 3.84% |
42.00 1.55% |
14.00 0.68% |
| 10-20 | 2304.00 31.92% |
1546.00 34.23% |
735.00 28.16% |
1931.00 32.21% |
145.00 29.71% |
85.00 23.55% |
375.00 29.62% |
1416.00 33.87% |
348.00 32.16% |
710.00 30.00% |
877.00 32.31% |
694.00 33.92% |
| 2-4 | 800.00 11.08% |
438.00 9.70% |
344.00 13.18% |
672.00 11.21% |
55.00 11.27% |
53.00 14.68% |
147.00 11.61% |
409.00 9.78% |
128.00 11.83% |
318.00 13.43% |
298.00 10.98% |
166.00 8.11% |
| 21-40 | 1223.00 16.94% |
790.00 17.49% |
422.00 16.17% |
1034.00 17.25% |
78.00 15.98% |
52.00 14.40% |
222.00 17.54% |
741.00 17.72% |
164.00 15.16% |
320.00 13.52% |
457.00 16.84% |
435.00 21.26% |
| 4-6 | 1091.00 15.11% |
637.00 14.10% |
443.00 16.97% |
912.00 15.21% |
77.00 15.78% |
71.00 19.67% |
213.00 16.82% |
586.00 14.02% |
175.00 16.17% |
406.00 17.15% |
418.00 15.40% |
256.00 12.51% |
| 7-9 | 1166.00 16.15% |
747.00 16.54% |
397.00 15.21% |
919.00 15.33% |
103.00 21.11% |
62.00 17.17% |
210.00 16.59% |
639.00 15.28% |
188.00 17.38% |
410.00 17.32% |
453.00 16.69% |
281.00 13.73% |
| Over 40 | 487.00 6.75% |
298.00 6.60% |
183.00 7.01% |
400.00 6.67% |
24.00 4.92% |
24.00 6.65% |
81.00 6.40% |
313.00 7.49% |
52.00 4.81% |
112.00 4.73% |
169.00 6.23% |
200.00 9.78% |


GVU's WWW Surveying Team
Graphics, Visualization, & Usability Center
College of Computing
Georgia Institute of Technology
Atlanta, GA 30332-0280