
| Image Loading | All | Male | Female | USA | Europe | 10-18 | 19-25 | 26-50 | 50+ | Novice | Intermediate | Expert |
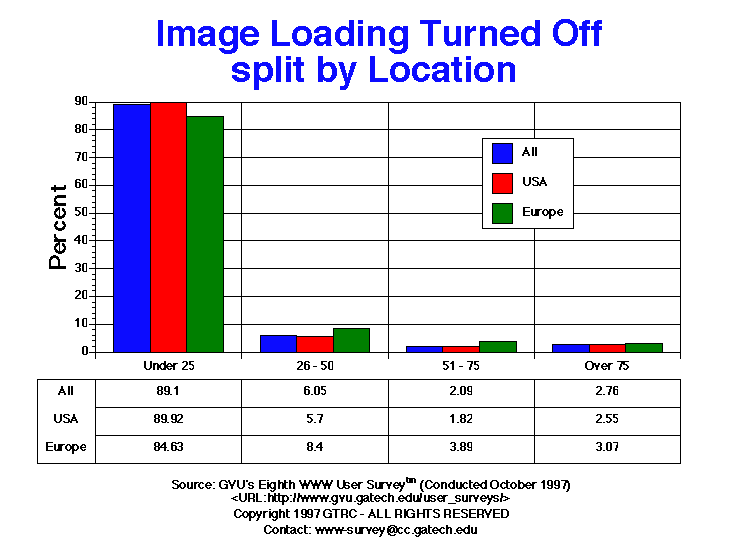
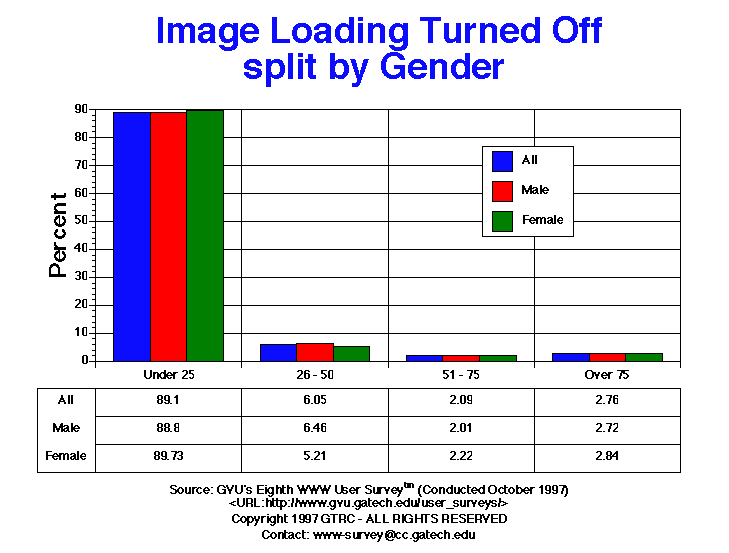
| 26-50 | 437.00 6.05% |
292.00 6.46% |
136.00 5.21% |
342.00 5.70% |
41.00 8.40% |
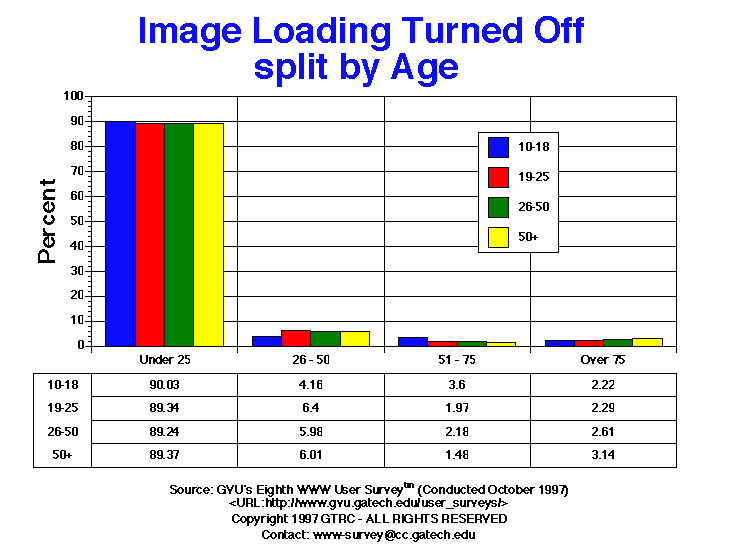
15.00 4.16% |
81.00 6.40% |
250.00 5.98% |
65.00 6.01% |
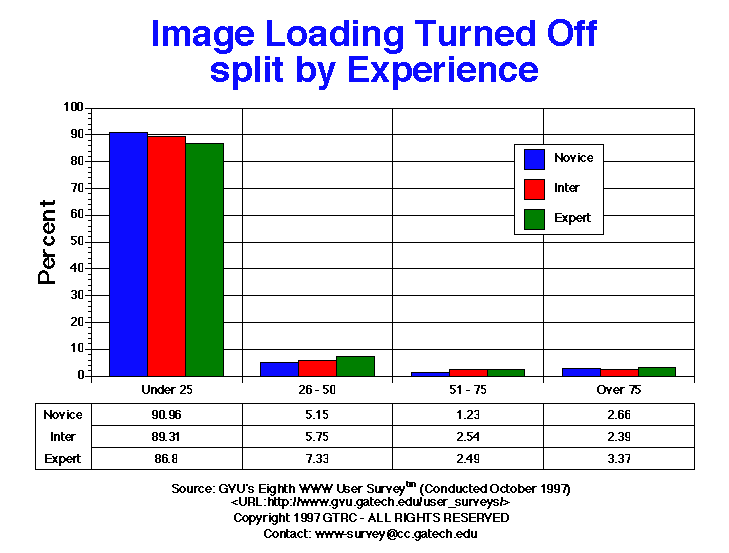
122.00 5.15% |
156.00 5.75% |
150.00 7.33% |
| 51-75 | 151.00 2.09% |
91.00 2.01% |
58.00 2.22% |
109.00 1.82% |
19.00 3.89% |
13.00 3.60% |
25.00 1.97% |
91.00 2.18% |
16.00 1.48% |
29.00 1.23% |
69.00 2.54% |
51.00 2.49% |
| Over 75 | 199.00 2.76% |
123.00 2.72% |
74.00 2.84% |
153.00 2.55% |
15.00 3.07% |
8.00 2.22% |
29.00 2.29% |
109.00 2.61% |
34.00 3.14% |
63.00 2.66% |
65.00 2.39% |
69.00 3.37% |
| Under 25 | 6432.00 89.10% |
4011.00 88.80% |
2342.00 89.73% |
5391.00 89.92% |
413.00 84.63% |
325.00 90.03% |
1131.00 89.34% |
3731.00 89.24% |
967.00 89.37% |
2153.00 90.96% |
2424.00 89.31% |
1776.00 86.80% |


GVU's WWW Surveying Team
Graphics, Visualization, & Usability Center
College of Computing
Georgia Institute of Technology
Atlanta, GA 30332-0280