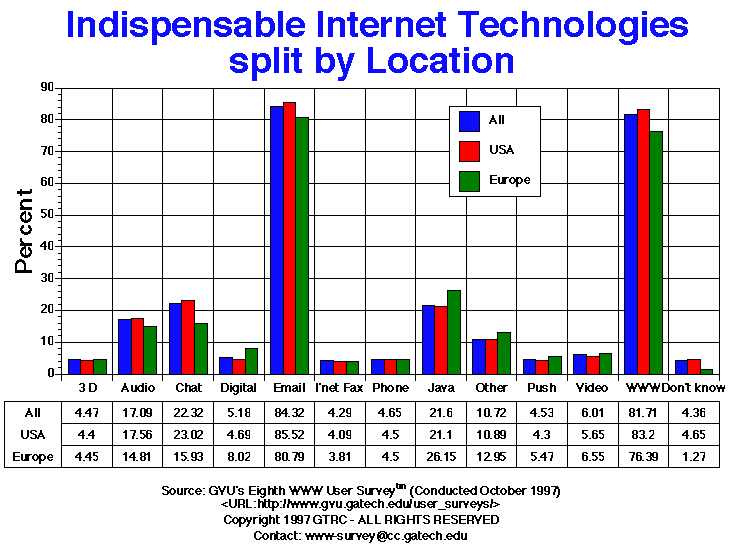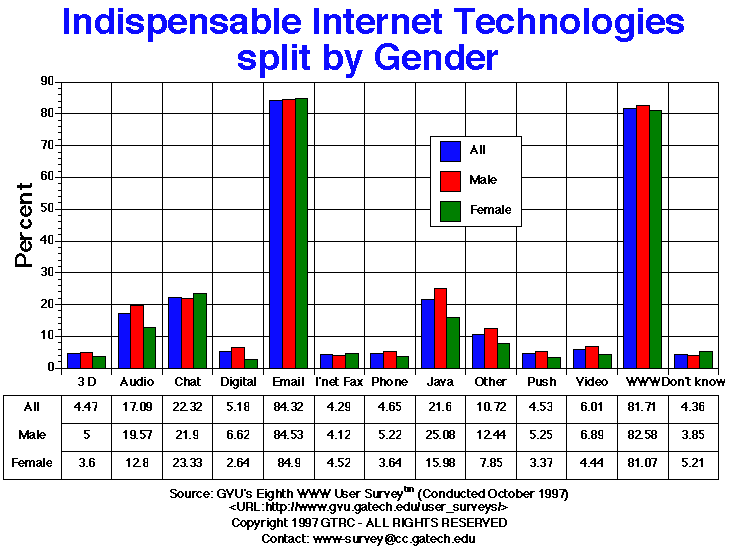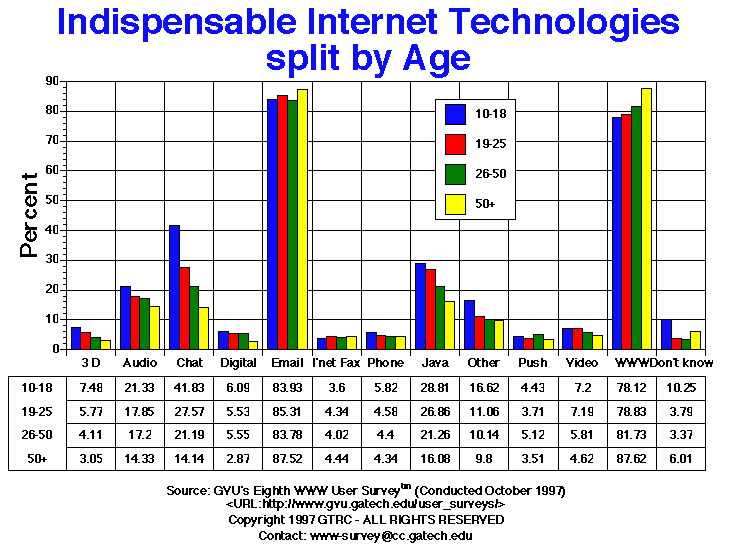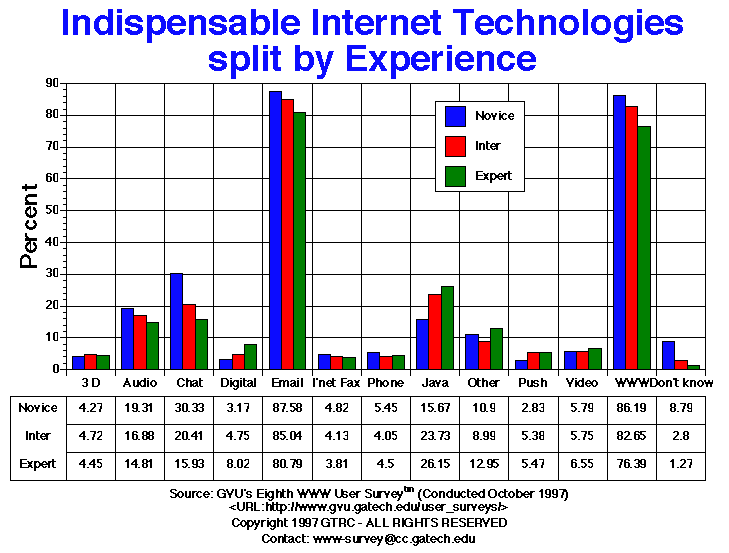

| Indispensable | All | Male | Female | USA | Europe | 10-18 | 19-25 | 26-50 | 50+ | Novice | Intermediate | Expert |
| 3-D | 323.00 4.47% |
226.00 5.00% |
94.00 3.60% |
264.00 4.40% |
91.00 4.45% |
27.00 7.48% |
73.00 5.77% |
172.00 4.11% |
33.00 3.05% |
101.00 4.27% |
128.00 4.72% |
91.00 4.45% |
| Audio | 1234.00 17.09% |
884.00 19.57% |
334.00 12.80% |
1053.00 17.56% |
303.00 14.81% |
77.00 21.33% |
226.00 17.85% |
719.00 17.20% |
155.00 14.33% |
457.00 19.31% |
458.00 16.88% |
303.00 14.81% |
| Chat | 1611.00 22.32% |
989.00 21.90% |
609.00 23.33% |
1380.00 23.02% |
326.00 15.93% |
151.00 41.83% |
349.00 27.57% |
886.00 21.19% |
153.00 14.14% |
718.00 30.33% |
554.00 20.41% |
326.00 15.93% |
| Digital sig | 374.00 5.18% |
299.00 6.62% |
69.00 2.64% |
281.00 4.69% |
164.00 8.02% |
22.00 6.09% |
70.00 5.53% |
232.00 5.55% |
31.00 2.87% |
75.00 3.17% |
129.00 4.75% |
164.00 8.02% |
| Don't know | 315.00 4.36% |
174.00 3.85% |
136.00 5.21% |
279.00 4.65% |
26.00 1.27% |
37.00 10.25% |
48.00 3.79% |
141.00 3.37% |
65.00 6.01% |
208.00 8.79% |
76.00 2.80% |
26.00 1.27% |
| 6087.00 84.32% |
3818.00 84.53% |
2216.00 84.90% |
5127.00 85.52% |
1653.00 80.79% |
303.00 83.93% |
1080.00 85.31% |
3503.00 83.78% |
947.00 87.52% |
2073.00 87.58% |
2308.00 85.04% |
1653.00 80.79% |
|
| Internet Fax | 310.00 4.29% |
186.00 4.12% |
118.00 4.52% |
245.00 4.09% |
78.00 3.81% |
13.00 3.60% |
55.00 4.34% |
168.00 4.02% |
48.00 4.44% |
114.00 4.82% |
112.00 4.13% |
78.00 3.81% |
| Internet Phone | 336.00 4.65% |
236.00 5.22% |
95.00 3.64% |
270.00 4.50% |
92.00 4.50% |
21.00 5.82% |
58.00 4.58% |
184.00 4.40% |
47.00 4.34% |
129.00 5.45% |
110.00 4.05% |
92.00 4.50% |
| Java | 1559.00 21.60% |
1133.00 25.08% |
417.00 15.98% |
1265.00 21.10% |
535.00 26.15% |
104.00 28.81% |
340.00 26.86% |
889.00 21.26% |
174.00 16.08% |
371.00 15.67% |
644.00 23.73% |
535.00 26.15% |
| Other | 774.00 10.72% |
562.00 12.44% |
205.00 7.85% |
653.00 10.89% |
265.00 12.95% |
60.00 16.62% |
140.00 11.06% |
424.00 10.14% |
106.00 9.80% |
258.00 10.90% |
244.00 8.99% |
265.00 12.95% |
| Push | 327.00 4.53% |
237.00 5.25% |
88.00 3.37% |
258.00 4.30% |
112.00 5.47% |
16.00 4.43% |
47.00 3.71% |
214.00 5.12% |
38.00 3.51% |
67.00 2.83% |
146.00 5.38% |
112.00 5.47% |
| Video | 434.00 6.01% |
311.00 6.89% |
116.00 4.44% |
339.00 5.65% |
134.00 6.55% |
26.00 7.20% |
91.00 7.19% |
243.00 5.81% |
50.00 4.62% |
137.00 5.79% |
156.00 5.75% |
134.00 6.55% |
| WWW | 5899.00 81.71% |
3730.00 82.58% |
2116.00 81.07% |
4988.00 83.20% |
1563.00 76.39% |
282.00 78.12% |
998.00 78.83% |
3417.00 81.73% |
948.00 87.62% |
2040.00 86.19% |
2243.00 82.65% |
1563.00 76.39% |


GVU's WWW Surveying Team
Graphics, Visualization, & Usability Center
College of Computing
Georgia Institute of Technology
Atlanta, GA 30332-0280