
| Instead of Watching TV | All | Male | Female | USA | Europe | 10-18 | 19-25 | 26-50 | 50+ | Novice | Intermediate | Expert |
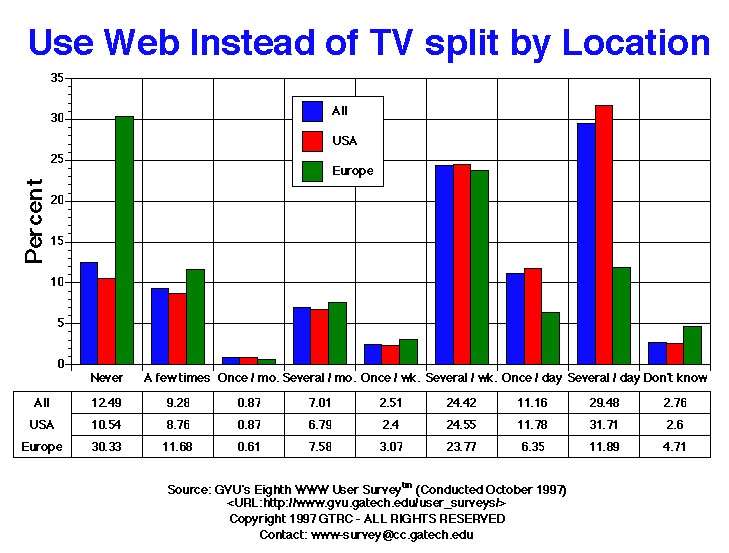
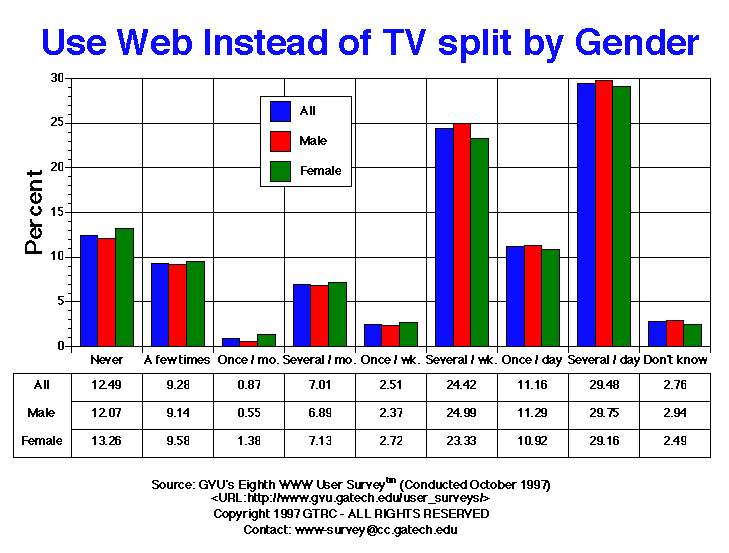
| A few times | 670.00 9.28% |
413.00 9.14% |
250.00 9.58% |
525.00 8.76% |
57.00 11.68% |
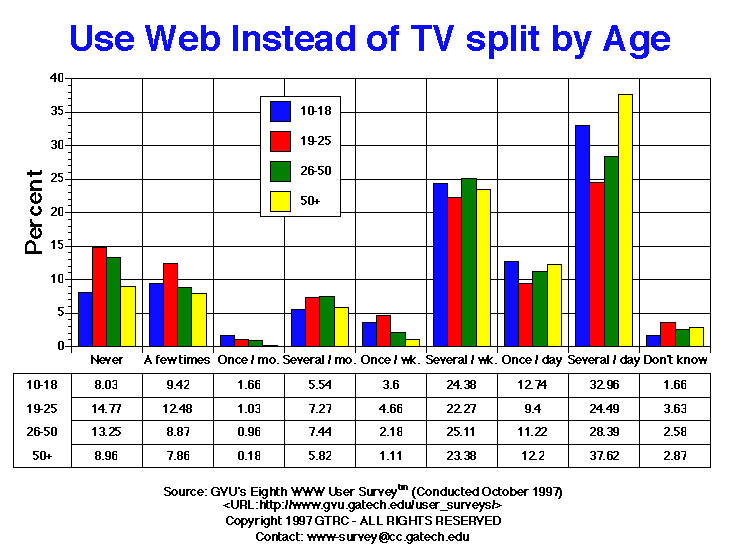
34.00 9.42% |
158.00 12.48% |
371.00 8.87% |
85.00 7.86% |
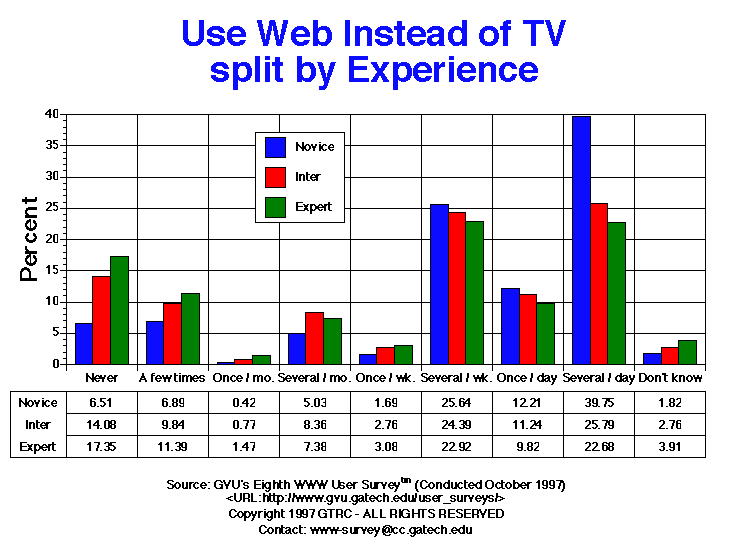
163.00 6.89% |
267.00 9.84% |
233.00 11.39% |
| Don't know | 199.00 2.76% |
133.00 2.94% |
65.00 2.49% |
156.00 2.60% |
23.00 4.71% |
6.00 1.66% |
46.00 3.63% |
108.00 2.58% |
31.00 2.87% |
43.00 1.82% |
75.00 2.76% |
80.00 3.91% |
| Never | 902.00 12.49% |
545.00 12.07% |
346.00 13.26% |
632.00 10.54% |
148.00 30.33% |
29.00 8.03% |
187.00 14.77% |
554.00 13.25% |
97.00 8.96% |
154.00 6.51% |
382.00 14.08% |
355.00 17.35% |
| Once | 1.00 0.01% |
0.00 0.00% |
1.00 0.04% |
0.00 0.00% |
0.00 0.00% |
0.00 0.00% |
0.00 0.00% |
0.00 0.00% |
0.00 0.00% |
1.00 0.04% |
0.00 0.00% |
0.00 0.00% |
| Once per day | 806.00 11.16% |
510.00 11.29% |
285.00 10.92% |
706.00 11.78% |
31.00 6.35% |
46.00 12.74% |
119.00 9.40% |
469.00 11.22% |
132.00 12.20% |
289.00 12.21% |
305.00 11.24% |
201.00 9.82% |
| Once per month | 63.00 0.87% |
25.00 0.55% |
36.00 1.38% |
52.00 0.87% |
3.00 0.61% |
6.00 1.66% |
13.00 1.03% |
40.00 0.96% |
2.00 0.18% |
10.00 0.42% |
21.00 0.77% |
30.00 1.47% |
| Once per week | 181.00 2.51% |
107.00 2.37% |
71.00 2.72% |
144.00 2.40% |
15.00 3.07% |
13.00 3.60% |
59.00 4.66% |
91.00 2.18% |
12.00 1.11% |
40.00 1.69% |
75.00 2.76% |
63.00 3.08% |
| Several times per day | 2128.00 29.48% |
1344.00 29.75% |
761.00 29.16% |
1901.00 31.71% |
58.00 11.89% |
119.00 32.96% |
310.00 24.49% |
1187.00 28.39% |
407.00 37.62% |
941.00 39.75% |
700.00 25.79% |
464.00 22.68% |
| Several times per month | 506.00 7.01% |
311.00 6.89% |
186.00 7.13% |
407.00 6.79% |
37.00 7.58% |
20.00 5.54% |
92.00 7.27% |
311.00 7.44% |
63.00 5.82% |
119.00 5.03% |
227.00 8.36% |
151.00 7.38% |
| Several times per week | 1763.00 24.42% |
1129.00 24.99% |
609.00 23.33% |
1472.00 24.55% |
116.00 23.77% |
88.00 24.38% |
282.00 22.27% |
1050.00 25.11% |
253.00 23.38% |
607.00 25.64% |
662.00 24.39% |
469.00 22.92% |
GVU's WWW Surveying Team
Graphics, Visualization, & Usability Center
College of Computing
Georgia Institute of Technology
Atlanta, GA 30332-0280