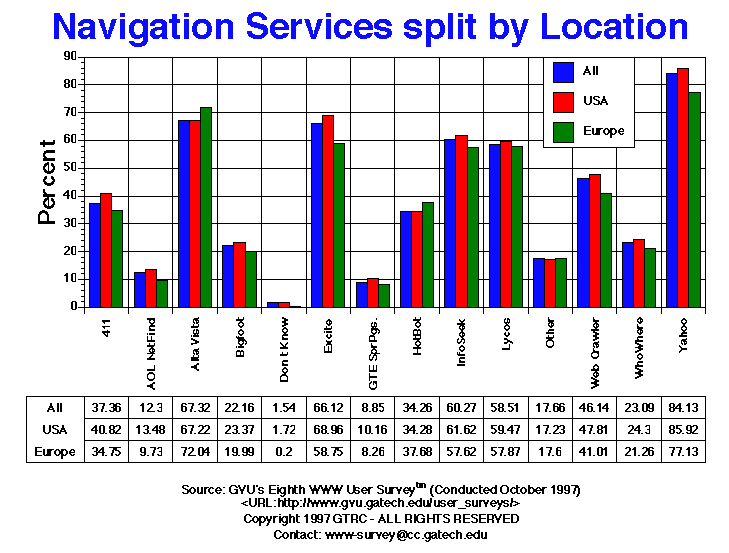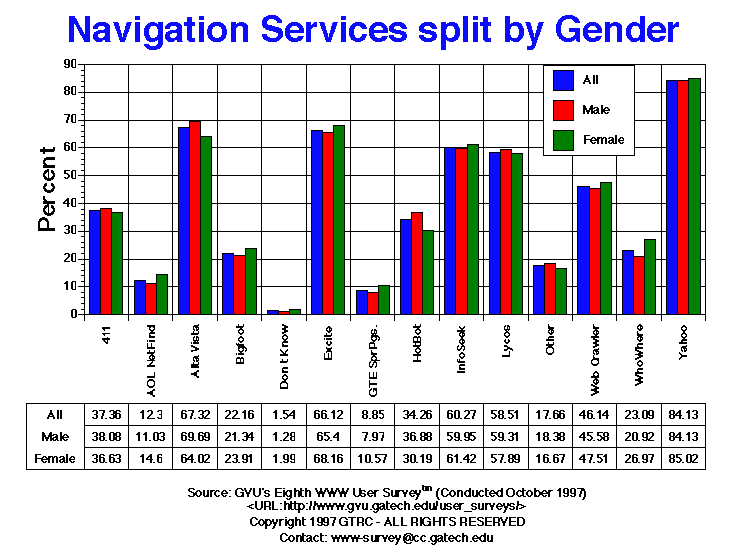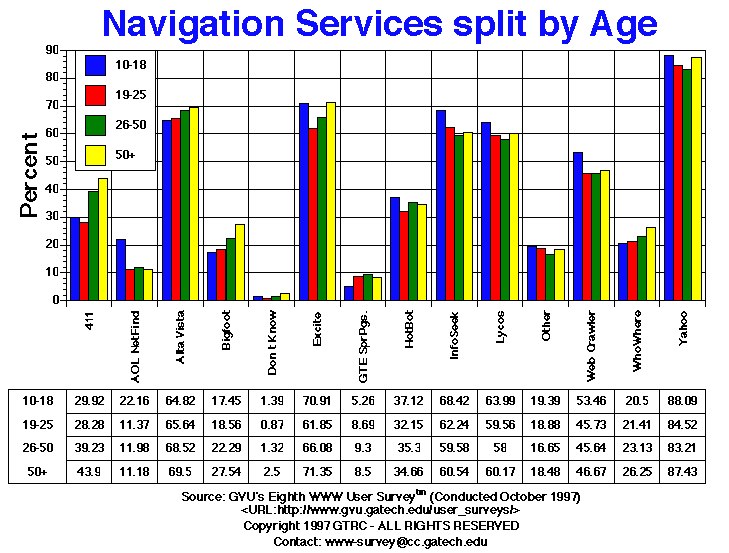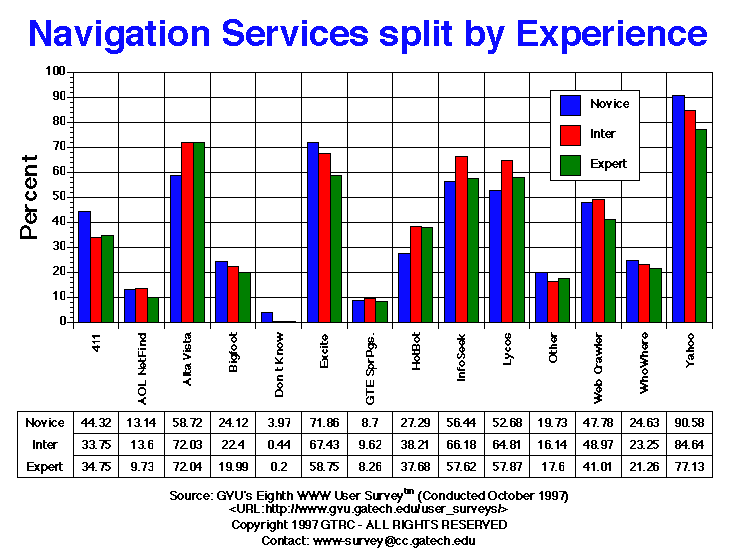

| Navigation Services | All | Male | Female | USA | Europe | 10-18 | 19-25 | 26-50 | 50+ | Novice | Intermediate | Expert |
| 411 | 2697.00 37.36% |
1720.00 38.08% |
956.00 36.63% |
2447.00 40.82% |
711.00 34.75% |
108.00 29.92% |
358.00 28.28% |
1640.00 39.23% |
475.00 43.90% |
1049.00 44.32% |
916.00 33.75% |
711.00 34.75% |
| AOL NetFind | 888.00 12.30% |
498.00 11.03% |
381.00 14.60% |
808.00 13.48% |
199.00 9.73% |
80.00 22.16% |
144.00 11.37% |
501.00 11.98% |
121.00 11.18% |
311.00 13.14% |
369.00 13.60% |
199.00 9.73% |
| Alta Vista | 4860.00 67.32% |
3148.00 69.69% |
1671.00 64.02% |
4030.00 67.22% |
1474.00 72.04% |
234.00 64.82% |
831.00 65.64% |
2865.00 68.52% |
752.00 69.50% |
1390.00 58.72% |
1955.00 72.03% |
1474.00 72.04% |
| Bigfoot | 1600.00 22.16% |
964.00 21.34% |
624.00 23.91% |
1401.00 23.37% |
409.00 19.99% |
63.00 17.45% |
235.00 18.56% |
932.00 22.29% |
298.00 27.54% |
571.00 24.12% |
608.00 22.40% |
409.00 19.99% |
| Don t Know | 111.00 1.54% |
58.00 1.28% |
52.00 1.99% |
103.00 1.72% |
4.00 0.20% |
5.00 1.39% |
11.00 0.87% |
55.00 1.32% |
27.00 2.50% |
94.00 3.97% |
12.00 0.44% |
4.00 0.20% |
| Excite | 4773.00 66.12% |
2954.00 65.40% |
1779.00 68.16% |
4134.00 68.96% |
1202.00 58.75% |
256.00 70.91% |
783.00 61.85% |
2763.00 66.08% |
772.00 71.35% |
1701.00 71.86% |
1830.00 67.43% |
1202.00 58.75% |
| GTE SuperPages | 639.00 8.85% |
360.00 7.97% |
276.00 10.57% |
609.00 10.16% |
169.00 8.26% |
19.00 5.26% |
110.00 8.69% |
389.00 9.30% |
92.00 8.50% |
206.00 8.70% |
261.00 9.62% |
169.00 8.26% |
| HotBot | 2473.00 34.26% |
1666.00 36.88% |
788.00 30.19% |
2055.00 34.28% |
771.00 37.68% |
134.00 37.12% |
407.00 32.15% |
1476.00 35.30% |
375.00 34.66% |
646.00 27.29% |
1037.00 38.21% |
771.00 37.68% |
| InfoSeek | 4351.00 60.27% |
2708.00 59.95% |
1603.00 61.42% |
3694.00 61.62% |
1179.00 57.62% |
247.00 68.42% |
788.00 62.24% |
2491.00 59.58% |
655.00 60.54% |
1336.00 56.44% |
1796.00 66.18% |
1179.00 57.62% |
| Lycos | 4224.00 58.51% |
2679.00 59.31% |
1511.00 57.89% |
3565.00 59.47% |
1184.00 57.87% |
231.00 63.99% |
754.00 59.56% |
2425.00 58.00% |
651.00 60.17% |
1247.00 52.68% |
1759.00 64.81% |
1184.00 57.87% |
| Other | 1275.00 17.66% |
830.00 18.38% |
435.00 16.67% |
1033.00 17.23% |
360.00 17.60% |
70.00 19.39% |
239.00 18.88% |
696.00 16.65% |
200.00 18.48% |
467.00 19.73% |
438.00 16.14% |
360.00 17.60% |
| Web Crawler | 3331.00 46.14% |
2059.00 45.58% |
1240.00 47.51% |
2866.00 47.81% |
839.00 41.01% |
193.00 53.46% |
579.00 45.73% |
1908.00 45.64% |
505.00 46.67% |
1131.00 47.78% |
1329.00 48.97% |
839.00 41.01% |
| WhoWhere | 1667.00 23.09% |
945.00 20.92% |
704.00 26.97% |
1457.00 24.30% |
435.00 21.26% |
74.00 20.50% |
271.00 21.41% |
967.00 23.13% |
284.00 26.25% |
583.00 24.63% |
631.00 23.25% |
435.00 21.26% |
| Yahoo | 6073.00 84.13% |
3800.00 84.13% |
2219.00 85.02% |
5151.00 85.92% |
1578.00 77.13% |
318.00 88.09% |
1070.00 84.52% |
3479.00 83.21% |
946.00 87.43% |
2144.00 90.58% |
2297.00 84.64% |
1578.00 77.13% |


GVU's WWW Surveying Team
Graphics, Visualization, & Usability Center
College of Computing
Georgia Institute of Technology
Atlanta, GA 30332-0280