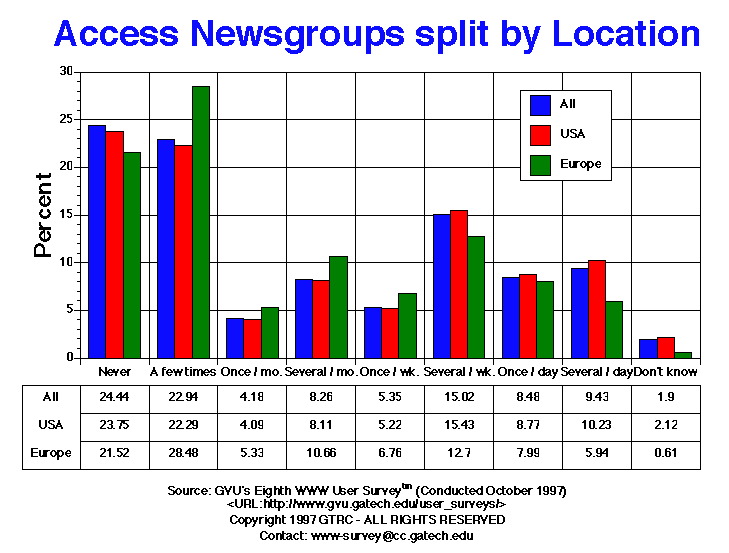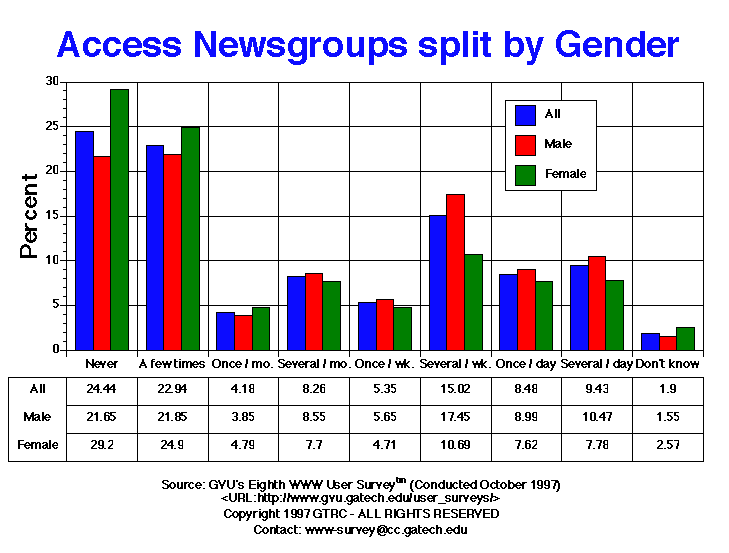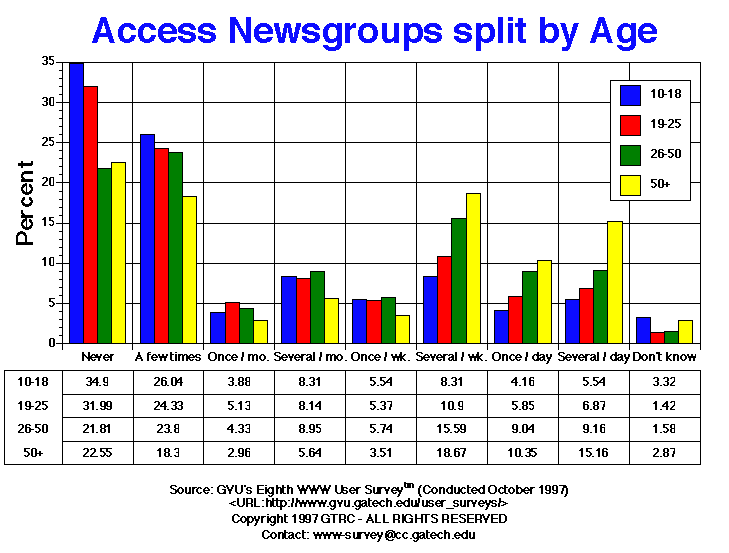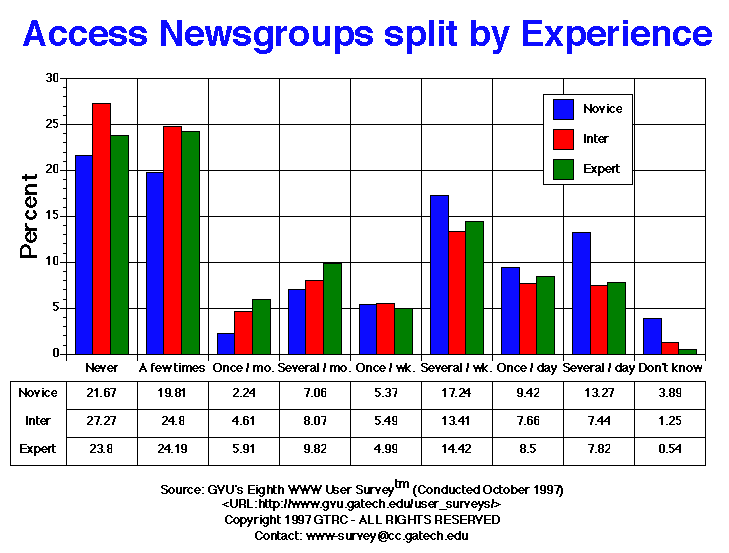

| Newsgroups | All | Male | Female | USA | Europe | 10-18 | 19-25 | 26-50 | 50+ | Novice | Intermediate | Expert |
| A | 1.00 0.01% |
0.00 0.00% |
1.00 0.04% |
0.00 0.00% |
0.00 0.00% |
0.00 0.00% |
0.00 0.00% |
0.00 0.00% |
0.00 0.00% |
1.00 0.04% |
0.00 0.00% |
0.00 0.00% |
| A few times | 1656.00 22.94% |
987.00 21.85% |
650.00 24.90% |
1336.00 22.29% |
139.00 28.48% |
94.00 26.04% |
308.00 24.33% |
995.00 23.80% |
198.00 18.30% |
469.00 19.81% |
673.00 24.80% |
495.00 24.19% |
| Don't know | 137.00 1.90% |
70.00 1.55% |
67.00 2.57% |
127.00 2.12% |
3.00 0.61% |
12.00 3.32% |
18.00 1.42% |
66.00 1.58% |
31.00 2.87% |
92.00 3.89% |
34.00 1.25% |
11.00 0.54% |
| Never | 1764.00 24.44% |
978.00 21.65% |
762.00 29.20% |
1424.00 23.75% |
105.00 21.52% |
126.00 34.90% |
405.00 31.99% |
912.00 21.81% |
244.00 22.55% |
513.00 21.67% |
740.00 27.27% |
487.00 23.80% |
| Once per day | 612.00 8.48% |
406.00 8.99% |
199.00 7.62% |
526.00 8.77% |
39.00 7.99% |
15.00 4.16% |
74.00 5.85% |
378.00 9.04% |
112.00 10.35% |
223.00 9.42% |
208.00 7.66% |
174.00 8.50% |
| Once per month | 302.00 4.18% |
174.00 3.85% |
125.00 4.79% |
245.00 4.09% |
26.00 5.33% |
14.00 3.88% |
65.00 5.13% |
181.00 4.33% |
32.00 2.96% |
53.00 2.24% |
125.00 4.61% |
121.00 5.91% |
| Once per week | 386.00 5.35% |
255.00 5.65% |
123.00 4.71% |
313.00 5.22% |
33.00 6.76% |
20.00 5.54% |
68.00 5.37% |
240.00 5.74% |
38.00 3.51% |
127.00 5.37% |
149.00 5.49% |
102.00 4.99% |
| Several times per day | 681.00 9.43% |
473.00 10.47% |
203.00 7.78% |
613.00 10.23% |
29.00 5.94% |
20.00 5.54% |
87.00 6.87% |
383.00 9.16% |
164.00 15.16% |
314.00 13.27% |
202.00 7.44% |
160.00 7.82% |
| Several times per month | 596.00 8.26% |
386.00 8.55% |
201.00 7.70% |
486.00 8.11% |
52.00 10.66% |
30.00 8.31% |
103.00 8.14% |
374.00 8.95% |
61.00 5.64% |
167.00 7.06% |
219.00 8.07% |
201.00 9.82% |
| Several times per week | 1084.00 15.02% |
788.00 17.45% |
279.00 10.69% |
925.00 15.43% |
62.00 12.70% |
30.00 8.31% |
138.00 10.90% |
652.00 15.59% |
202.00 18.67% |
408.00 17.24% |
364.00 13.41% |
295.00 14.42% |


GVU's WWW Surveying Team
Graphics, Visualization, & Usability Center
College of Computing
Georgia Institute of Technology
Atlanta, GA 30332-0280