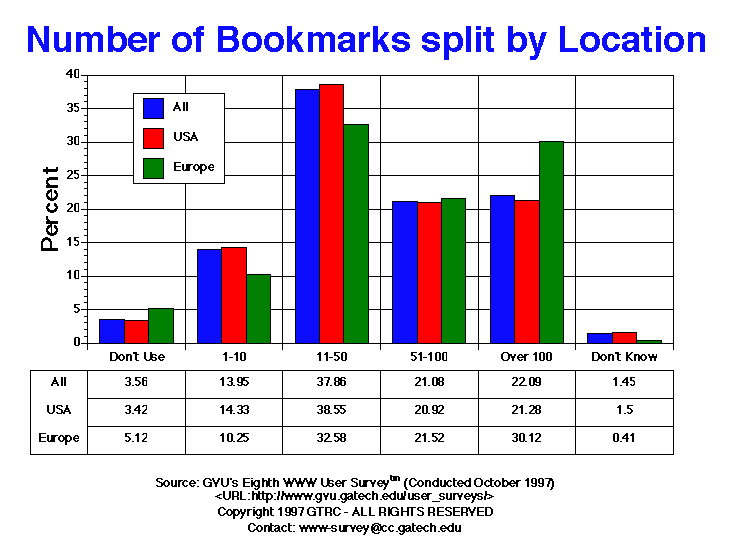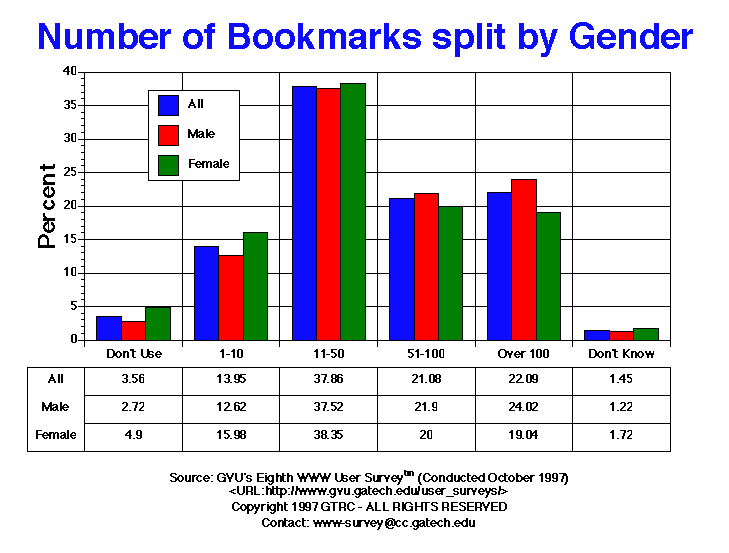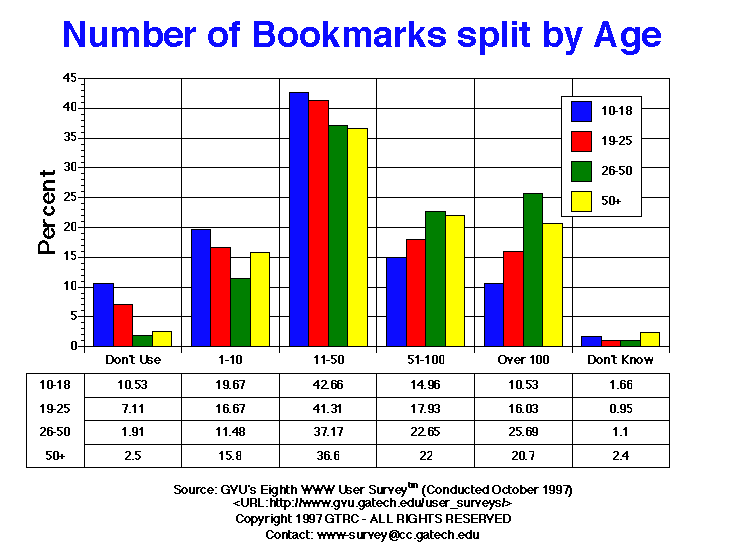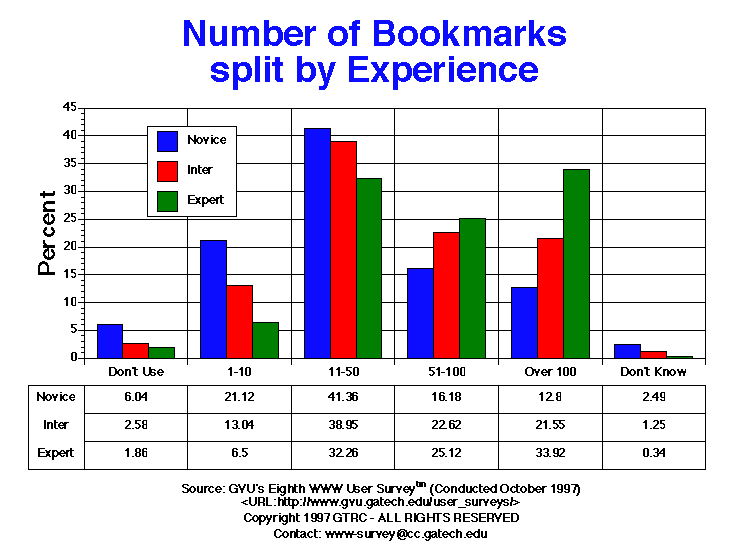

| Number of Items in Favorites/Bookmark | All | Male | Female | USA | Europe | 10-18 | 19-25 | 26-50 | 50+ | Novice | Intermediate | Expert |
| 1-10 | 1007.00 13.95% |
570.00 12.62% |
417.00 15.98% |
859.00 14.33% |
50.00 10.25% |
71.00 19.67% |
211.00 16.67% |
480.00 11.48% |
171.00 15.80% |
500.00 21.12% |
354.00 13.04% |
133.00 6.50% |
| 11-50 | 2733.00 37.86% |
1695.00 37.52% |
1001.00 38.35% |
2311.00 38.55% |
159.00 32.58% |
154.00 42.66% |
523.00 41.31% |
1554.00 37.17% |
396.00 36.60% |
979.00 41.36% |
1057.00 38.95% |
660.00 32.26% |
| 51-100 | 1522.00 21.08% |
989.00 21.90% |
522.00 20.00% |
1254.00 20.92% |
105.00 21.52% |
54.00 14.96% |
227.00 17.93% |
947.00 22.65% |
238.00 22.00% |
383.00 16.18% |
614.00 22.62% |
514.00 25.12% |
| Don't Know | 105.00 1.45% |
55.00 1.22% |
45.00 1.72% |
90.00 1.50% |
2.00 0.41% |
6.00 1.66% |
12.00 0.95% |
46.00 1.10% |
26.00 2.40% |
59.00 2.49% |
34.00 1.25% |
7.00 0.34% |
| Don't Use | 257.00 3.56% |
123.00 2.72% |
128.00 4.90% |
205.00 3.42% |
25.00 5.12% |
38.00 10.53% |
90.00 7.11% |
80.00 1.91% |
27.00 2.50% |
143.00 6.04% |
70.00 2.58% |
38.00 1.86% |
| Over 100 | 1595.00 22.09% |
1085.00 24.02% |
497.00 19.04% |
1276.00 21.28% |
147.00 30.12% |
38.00 10.53% |
203.00 16.03% |
1074.00 25.69% |
224.00 20.70% |
303.00 12.80% |
585.00 21.55% |
694.00 33.92% |


GVU's WWW Surveying Team
Graphics, Visualization, & Usability Center
College of Computing
Georgia Institute of Technology
Atlanta, GA 30332-0280