
| Personal | All | Male | Female | USA | Europe | 10-18 | 19-25 | 26-50 | 50+ | Novice | Intermediate | Expert |
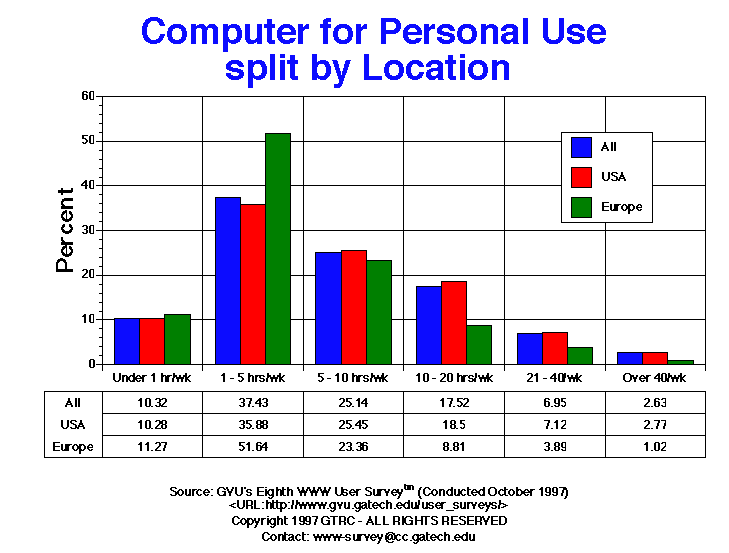
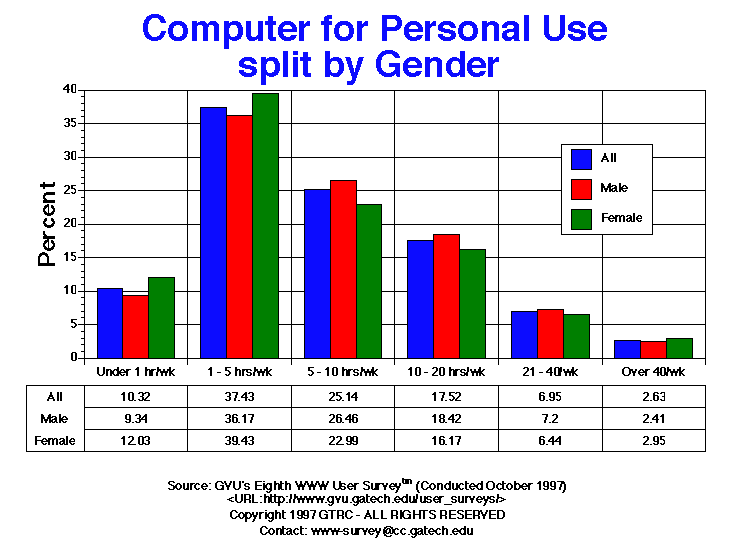
| 1-5 hrs | 2702.00 37.43% |
1634.00 36.17% |
1029.00 39.43% |
2151.00 35.88% |
252.00 51.64% |
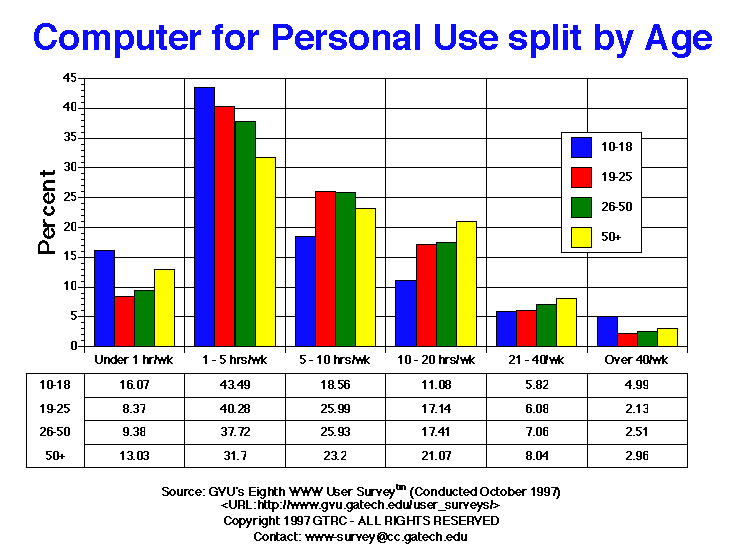
157.00 43.49% |
510.00 40.28% |
1577.00 37.72% |
343.00 31.70% |
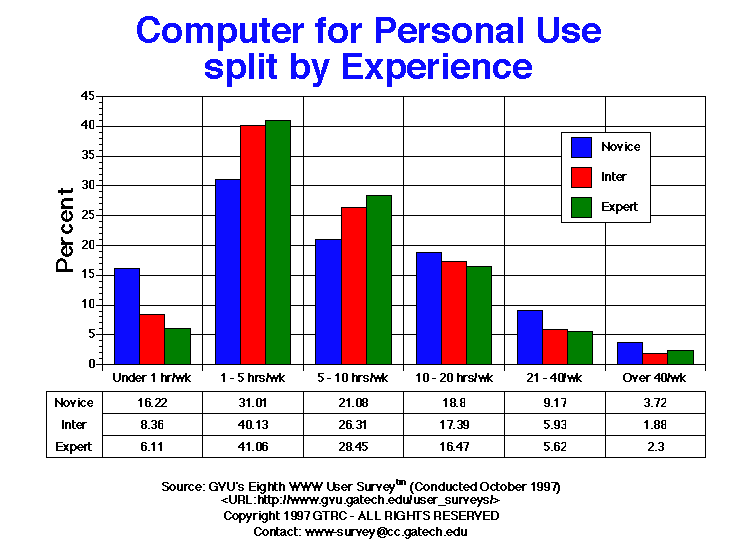
734.00 31.01% |
1089.00 40.13% |
840.00 41.06% |
| 10-20 hrs | 1265.00 17.52% |
832.00 18.42% |
422.00 16.17% |
1109.00 18.50% |
43.00 8.81% |
40.00 11.08% |
217.00 17.14% |
728.00 17.41% |
228.00 21.07% |
445.00 18.80% |
472.00 17.39% |
337.00 16.47% |
| 21-40 | 502.00 6.95% |
325.00 7.20% |
168.00 6.44% |
427.00 7.12% |
19.00 3.89% |
21.00 5.82% |
77.00 6.08% |
295.00 7.06% |
87.00 8.04% |
217.00 9.17% |
161.00 5.93% |
115.00 5.62% |
| 5-10 hrs | 1815.00 25.14% |
1195.00 26.46% |
600.00 22.99% |
1526.00 25.45% |
114.00 23.36% |
67.00 18.56% |
329.00 25.99% |
1084.00 25.93% |
251.00 23.20% |
499.00 21.08% |
714.00 26.31% |
582.00 28.45% |
| Over 40 | 190.00 2.63% |
109.00 2.41% |
77.00 2.95% |
166.00 2.77% |
5.00 1.02% |
18.00 4.99% |
27.00 2.13% |
105.00 2.51% |
32.00 2.96% |
88.00 3.72% |
51.00 1.88% |
47.00 2.30% |
| Under 1 hr | 745.00 10.32% |
422.00 9.34% |
314.00 12.03% |
616.00 10.28% |
55.00 11.27% |
58.00 16.07% |
106.00 8.37% |
392.00 9.38% |
141.00 13.03% |
384.00 16.22% |
227.00 8.36% |
125.00 6.11% |


GVU's WWW Surveying Team
Graphics, Visualization, & Usability Center
College of Computing
Georgia Institute of Technology
Atlanta, GA 30332-0280