
| Problems Using the Web | All | Male | Female | USA | Europe | 10-18 | 19-25 | 26-50 | 50+ | Novice | Intermediate | Expert |
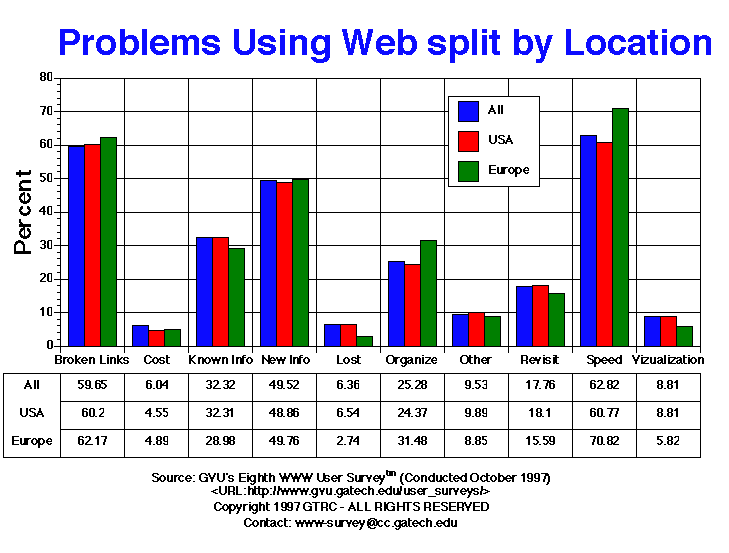
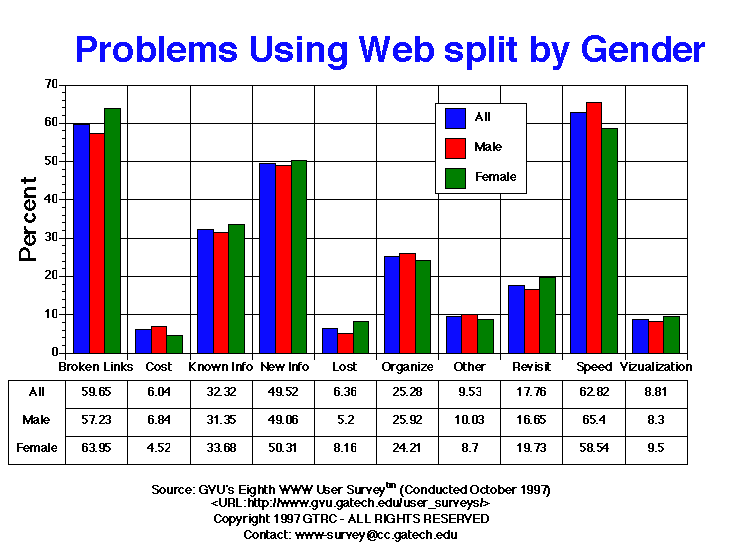
| Broken Links | 4306.00 59.65% |
2585.00 57.23% |
1669.00 63.95% |
3609.00 60.20% |
1272.00 62.17% |
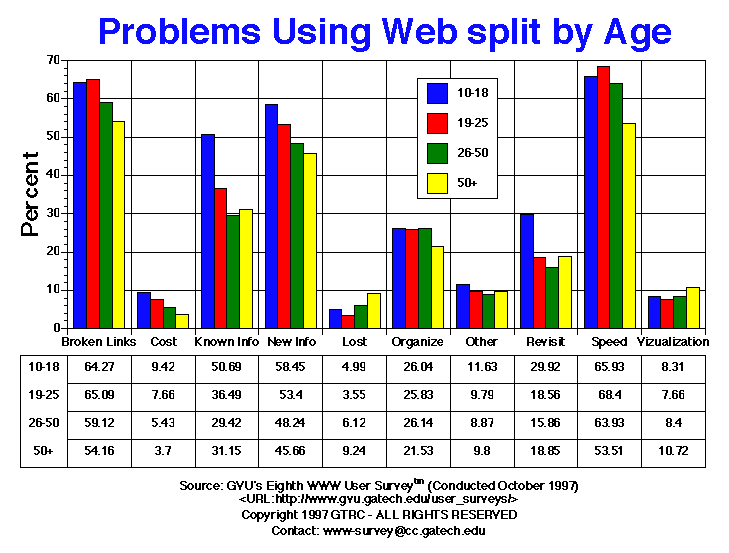
232.00 64.27% |
824.00 65.09% |
2472.00 59.12% |
586.00 54.16% |
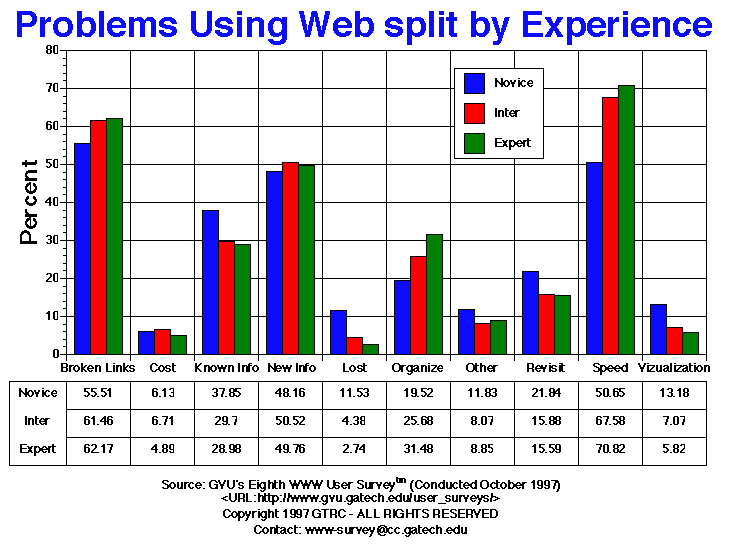
1314.00 55.51% |
1668.00 61.46% |
1272.00 62.17% |
| Cost | 436.00 6.04% |
309.00 6.84% |
118.00 4.52% |
273.00 4.55% |
100.00 4.89% |
34.00 9.42% |
97.00 7.66% |
227.00 5.43% |
40.00 3.70% |
145.00 6.13% |
182.00 6.71% |
100.00 4.89% |
| Find Known Info | 2333.00 32.32% |
1416.00 31.35% |
879.00 33.68% |
1937.00 32.31% |
593.00 28.98% |
183.00 50.69% |
462.00 36.49% |
1230.00 29.42% |
337.00 31.15% |
896.00 37.85% |
806.00 29.70% |
593.00 28.98% |
| Find new info | 3575.00 49.52% |
2216.00 49.06% |
1313.00 50.31% |
2929.00 48.86% |
1018.00 49.76% |
211.00 58.45% |
676.00 53.40% |
2017.00 48.24% |
494.00 45.66% |
1140.00 48.16% |
1371.00 50.52% |
1018.00 49.76% |
| Lost | 459.00 6.36% |
235.00 5.20% |
213.00 8.16% |
392.00 6.54% |
56.00 2.74% |
18.00 4.99% |
45.00 3.55% |
256.00 6.12% |
100.00 9.24% |
273.00 11.53% |
119.00 4.38% |
56.00 2.74% |
| Organize | 1825.00 25.28% |
1171.00 25.92% |
632.00 24.21% |
1461.00 24.37% |
644.00 31.48% |
94.00 26.04% |
327.00 25.83% |
1093.00 26.14% |
233.00 21.53% |
462.00 19.52% |
697.00 25.68% |
644.00 31.48% |
| Other | 688.00 9.53% |
453.00 10.03% |
227.00 8.70% |
593.00 9.89% |
181.00 8.85% |
42.00 11.63% |
124.00 9.79% |
371.00 8.87% |
106.00 9.80% |
280.00 11.83% |
219.00 8.07% |
181.00 8.85% |
| Revisit | 1282.00 17.76% |
752.00 16.65% |
515.00 19.73% |
1085.00 18.10% |
319.00 15.59% |
108.00 29.92% |
235.00 18.56% |
663.00 15.86% |
204.00 18.85% |
517.00 21.84% |
431.00 15.88% |
319.00 15.59% |
| Speed | 4535.00 62.82% |
2954.00 65.40% |
1528.00 58.54% |
3643.00 60.77% |
1449.00 70.82% |
238.00 65.93% |
866.00 68.40% |
2673.00 63.93% |
579.00 53.51% |
1199.00 50.65% |
1834.00 67.58% |
1449.00 70.82% |
| Visualization | 636.00 8.81% |
375.00 8.30% |
248.00 9.50% |
528.00 8.81% |
119.00 5.82% |
30.00 8.31% |
97.00 7.66% |
351.00 8.40% |
116.00 10.72% |
312.00 13.18% |
192.00 7.07% |
119.00 5.82% |


GVU's WWW Surveying Team
Graphics, Visualization, & Usability Center
College of Computing
Georgia Institute of Technology
Atlanta, GA 30332-0280