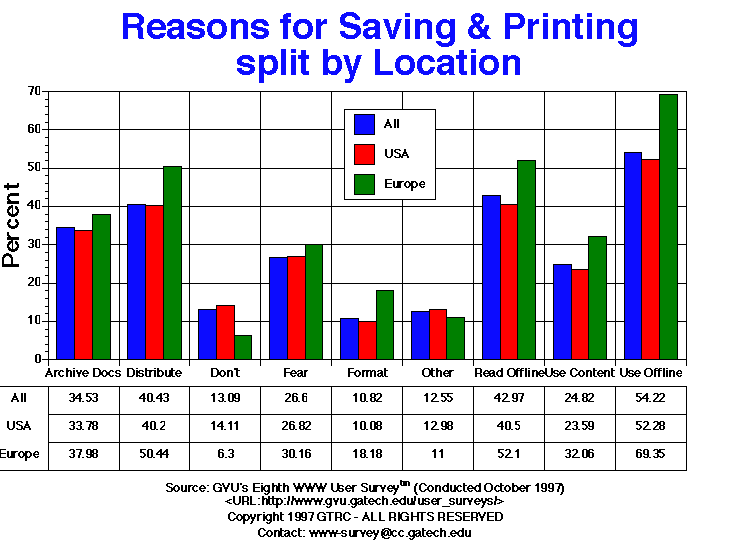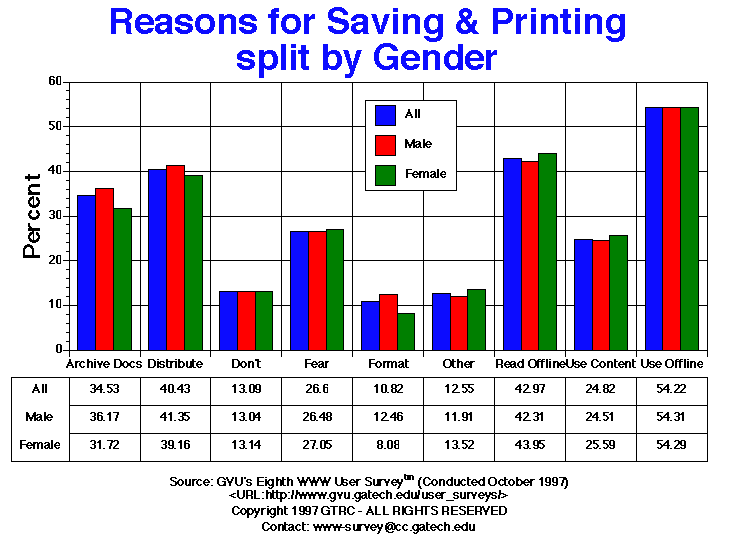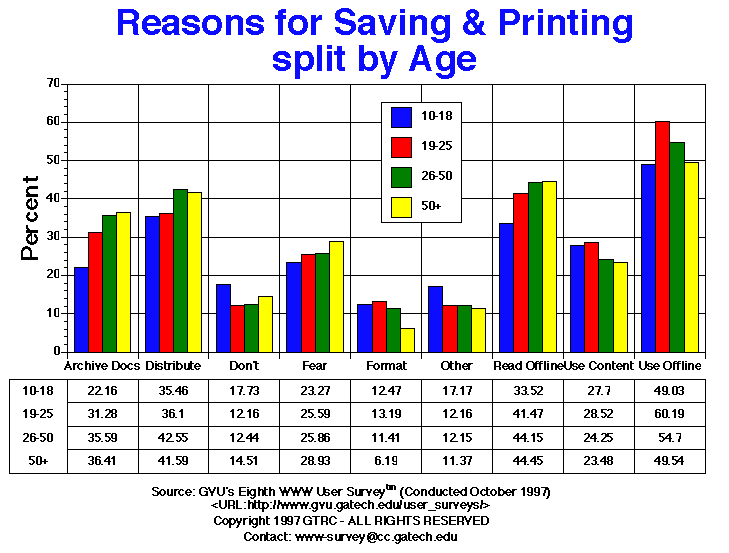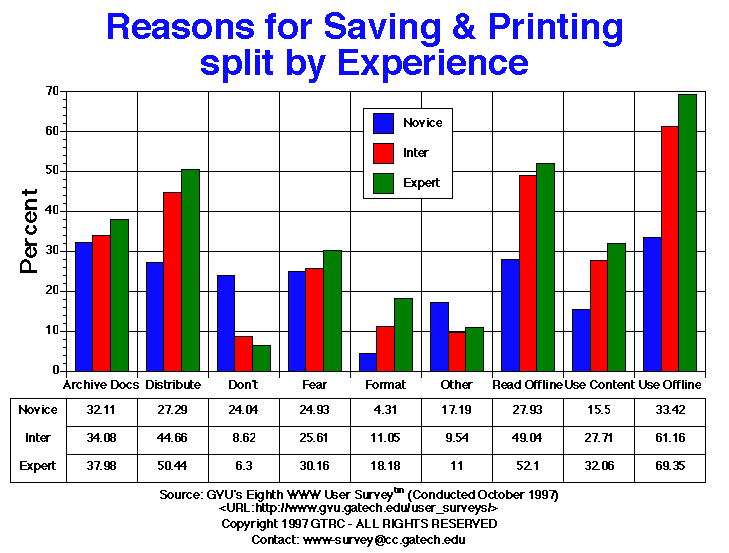

| Reasons For Saving and Printing Documents | All | Male | Female | USA | Europe | 10-18 | 19-25 | 26-50 | 50+ | Novice | Intermediate | Expert |
| Archive Docs | 2493.00 34.53% |
1634.00 36.17% |
828.00 31.72% |
2025.00 33.78% |
777.00 37.98% |
80.00 22.16% |
396.00 31.28% |
1488.00 35.59% |
394.00 36.41% |
760.00 32.11% |
925.00 34.08% |
777.00 37.98% |
| Distribute to Others Offline | 2919.00 40.43% |
1868.00 41.35% |
1022.00 39.16% |
2410.00 40.20% |
1032.00 50.44% |
128.00 35.46% |
457.00 36.10% |
1779.00 42.55% |
450.00 41.59% |
646.00 27.29% |
1212.00 44.66% |
1032.00 50.44% |
| Don t | 945.00 13.09% |
589.00 13.04% |
343.00 13.14% |
846.00 14.11% |
129.00 6.30% |
64.00 17.73% |
154.00 12.16% |
520.00 12.44% |
157.00 14.51% |
569.00 24.04% |
234.00 8.62% |
129.00 6.30% |
| Fear Doc Will Dissappear | 1920.00 26.60% |
1196.00 26.48% |
706.00 27.05% |
1608.00 26.82% |
617.00 30.16% |
84.00 23.27% |
324.00 25.59% |
1081.00 25.86% |
313.00 28.93% |
590.00 24.93% |
695.00 25.61% |
617.00 30.16% |
| Mimic Format | 781.00 10.82% |
563.00 12.46% |
211.00 8.08% |
604.00 10.08% |
372.00 18.18% |
45.00 12.47% |
167.00 13.19% |
477.00 11.41% |
67.00 6.19% |
102.00 4.31% |
300.00 11.05% |
372.00 18.18% |
| Other | 906.00 12.55% |
538.00 11.91% |
353.00 13.52% |
778.00 12.98% |
225.00 11.00% |
62.00 17.17% |
154.00 12.16% |
508.00 12.15% |
123.00 11.37% |
407.00 17.19% |
259.00 9.54% |
225.00 11.00% |
| Read Offline | 3102.00 42.97% |
1911.00 42.31% |
1147.00 43.95% |
2428.00 40.50% |
1066.00 52.10% |
121.00 33.52% |
525.00 41.47% |
1846.00 44.15% |
481.00 44.45% |
661.00 27.93% |
1331.00 49.04% |
1066.00 52.10% |
| Use Content | 1792.00 24.82% |
1107.00 24.51% |
668.00 25.59% |
1414.00 23.59% |
656.00 32.06% |
100.00 27.70% |
361.00 28.52% |
1014.00 24.25% |
254.00 23.48% |
367.00 15.50% |
752.00 27.71% |
656.00 32.06% |
| Use Offline | 3914.00 54.22% |
2453.00 54.31% |
1417.00 54.29% |
3134.00 52.28% |
1419.00 69.35% |
177.00 49.03% |
762.00 60.19% |
2287.00 54.70% |
536.00 49.54% |
791.00 33.42% |
1660.00 61.16% |
1419.00 69.35% |


GVU's WWW Surveying Team
Graphics, Visualization, & Usability Center
College of Computing
Georgia Institute of Technology
Atlanta, GA 30332-0280