
| Work | All | Male | Female | USA | Europe | 10-18 | 19-25 | 26-50 | 50+ | Novice | Intermediate | Expert |
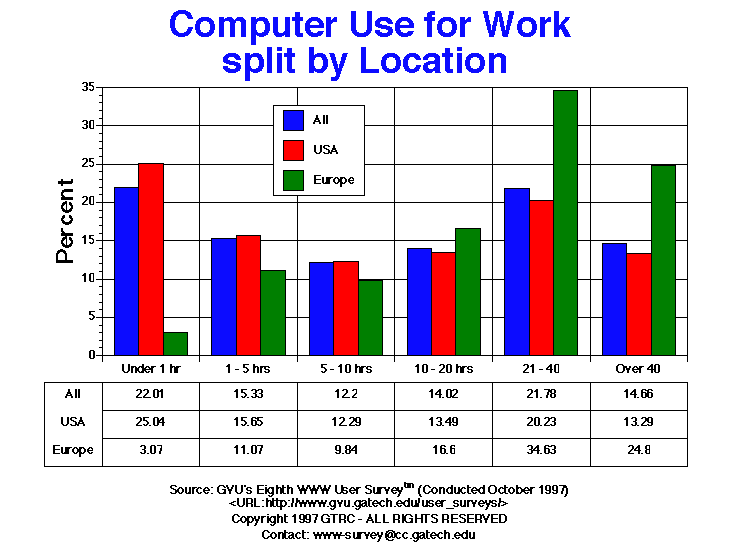
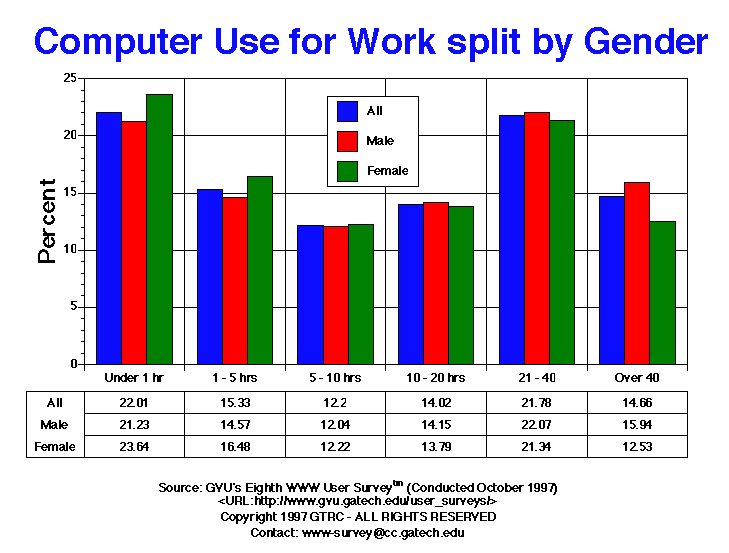
| 1-5 hrs | 1107.00 15.33% |
658.00 14.57% |
430.00 16.48% |
938.00 15.65% |
54.00 11.07% |
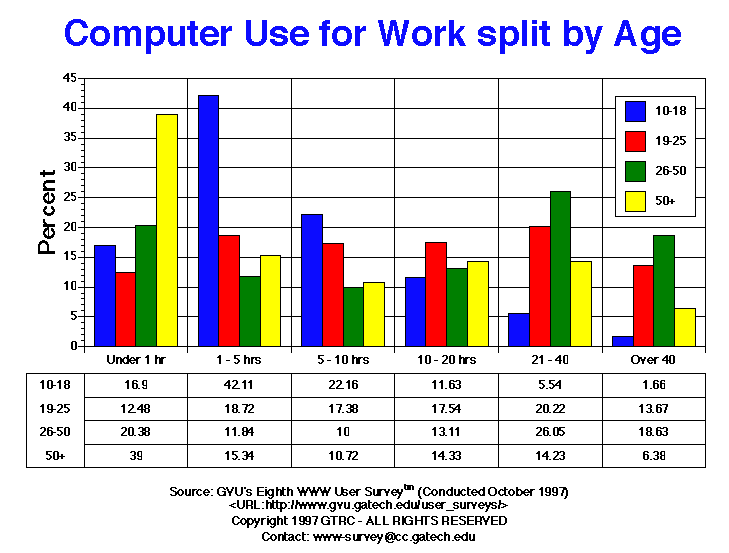
152.00 42.11% |
237.00 18.72% |
495.00 11.84% |
166.00 15.34% |
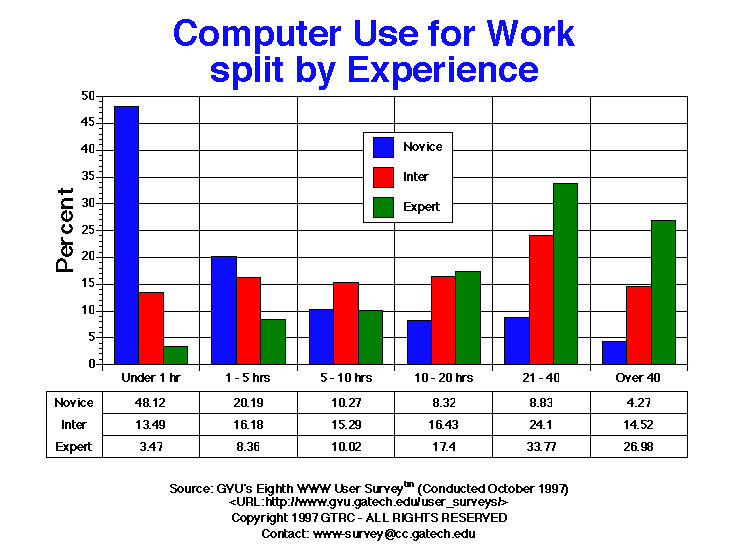
478.00 20.19% |
439.00 16.18% |
171.00 8.36% |
| 10-20 hrs | 1012.00 14.02% |
639.00 14.15% |
360.00 13.79% |
809.00 13.49% |
81.00 16.60% |
42.00 11.63% |
222.00 17.54% |
548.00 13.11% |
155.00 14.33% |
197.00 8.32% |
446.00 16.43% |
356.00 17.40% |
| 21-40 | 1572.00 21.78% |
997.00 22.07% |
557.00 21.34% |
1213.00 20.23% |
169.00 34.63% |
20.00 5.54% |
256.00 20.22% |
1089.00 26.05% |
154.00 14.23% |
209.00 8.83% |
654.00 24.10% |
691.00 33.77% |
| 5-10 hrs | 881.00 12.20% |
544.00 12.04% |
319.00 12.22% |
737.00 12.29% |
48.00 9.84% |
80.00 22.16% |
220.00 17.38% |
418.00 10.00% |
116.00 10.72% |
243.00 10.27% |
415.00 15.29% |
205.00 10.02% |
| Over 40 | 1058.00 14.66% |
720.00 15.94% |
327.00 12.53% |
797.00 13.29% |
121.00 24.80% |
6.00 1.66% |
173.00 13.67% |
779.00 18.63% |
69.00 6.38% |
101.00 4.27% |
394.00 14.52% |
552.00 26.98% |
| Under 1 hr | 1589.00 22.01% |
959.00 21.23% |
617.00 23.64% |
1501.00 25.04% |
15.00 3.07% |
61.00 16.90% |
158.00 12.48% |
852.00 20.38% |
422.00 39.00% |
1139.00 48.12% |
366.00 13.49% |
71.00 3.47% |


GVU's WWW Surveying Team
Graphics, Visualization, & Usability Center
College of Computing
Georgia Institute of Technology
Atlanta, GA 30332-0280