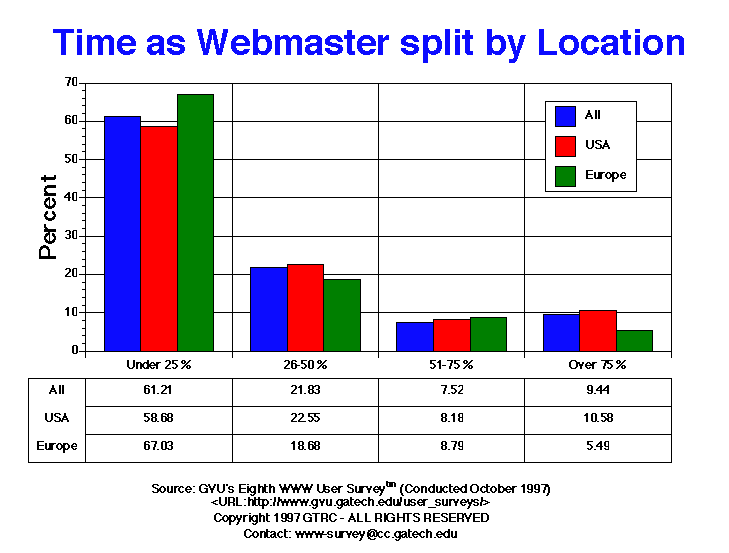

| Time Spent Being Webmaster | All | USA | Europe |
| 26-50 | 148.00 21.83% |
113.00 22.55% |
17.00 18.68% |
| 51-75 | 51.00 7.52% |
41.00 8.18% |
8.00 8.79% |
| Over 75 | 64.00 9.44% |
53.00 10.58% |
5.00 5.49% |
| Under 25 | 415.00 61.21% |
294.00 58.68% |
61.00 67.03% |

GVU's WWW Surveying Team
Graphics, Visualization, & Usability Center
College of Computing
Georgia Institute of Technology
Atlanta, GA 30332-0280