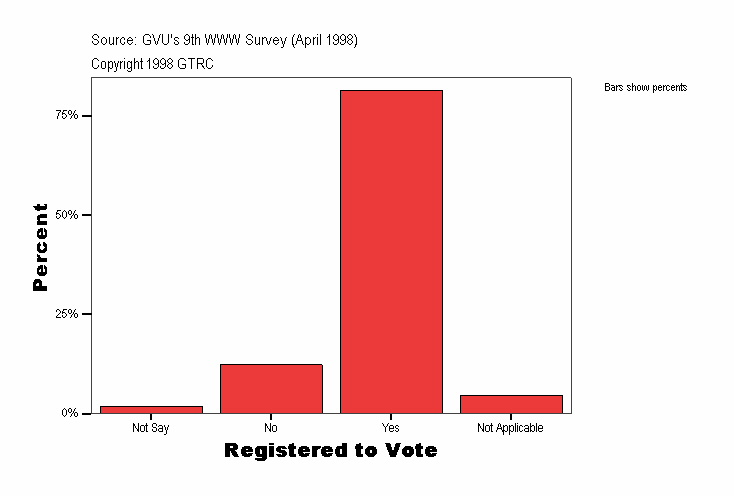
Registered to Vote
|
Frequency |
Percent |
Valid Percent |
Cumulative Percent |
|---|
| Valid |
Not Say |
228
| 1.8
| 1.8
| 1.8
|
|---|
| No |
1546
| 12.3
| 12.3
| 14.1
|
|---|
| Yes |
10237
| 81.3
| 81.3
| 95.4
|
|---|
| Not Applicable |
580
| 4.6
| 4.6
| 100.0
|
|---|
| Total |
12591
| 100.0
| 100.0
|
|
|---|
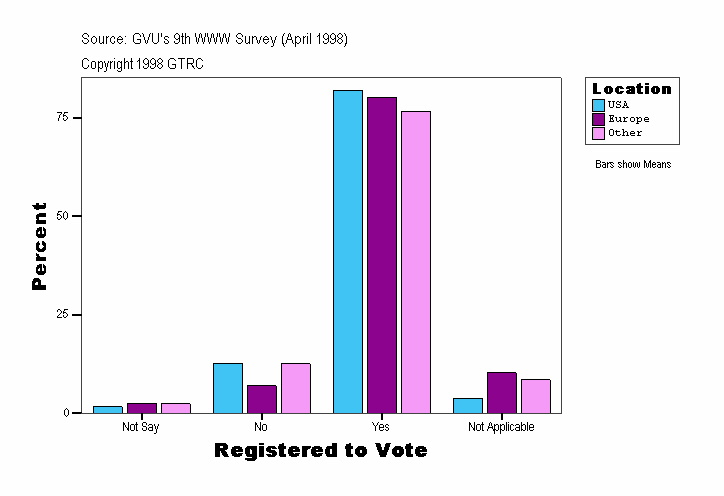
Registered to Vote
| Location |
Frequency |
Percent |
Valid Percent |
Cumulative Percent |
|---|
| USA |
Valid |
Not Say |
179
| 1.7
| 1.7
| 1.7
|
|---|
| No |
1340
| 12.6
| 12.6
| 14.3
|
|---|
| Yes |
8705
| 81.9
| 81.9
| 96.2
|
|---|
| Not Applicable |
400
| 3.8
| 3.8
| 100.0
|
|---|
| Total |
10624
| 100.0
| 100.0
|
|
|---|
| Europe |
Valid |
Not Say |
19
| 2.6
| 2.6
| 2.6
|
|---|
| No |
51
| 7.0
| 7.0
| 9.6
|
|---|
| Yes |
586
| 80.2
| 80.2
| 89.7
|
|---|
| Not Applicable |
75
| 10.3
| 10.3
| 100.0
|
|---|
| Total |
731
| 100.0
| 100.0
|
|
|---|
| Other |
Valid |
Not Say |
30
| 2.4
| 2.4
| 2.4
|
|---|
| No |
155
| 12.5
| 12.5
| 15.0
|
|---|
| Yes |
946
| 76.5
| 76.5
| 91.5
|
|---|
| Not Applicable |
105
| 8.5
| 8.5
| 100.0
|
|---|
| Total |
1236
| 100.0
| 100.0
|
|
|---|
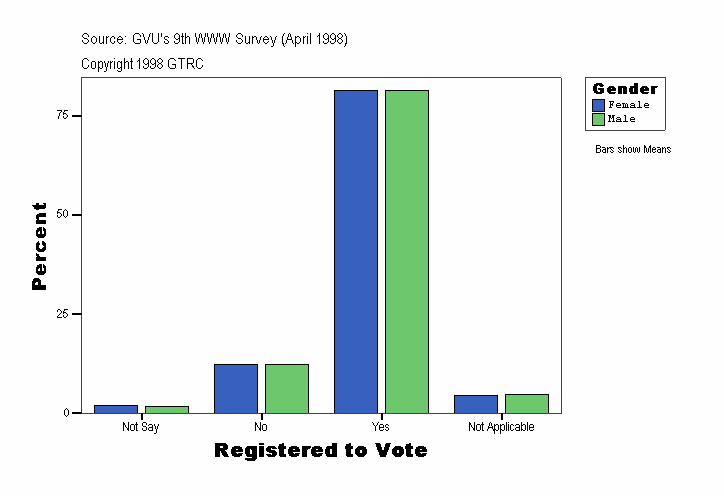
Registered to Vote
| Gender |
Frequency |
Percent |
Valid Percent |
Cumulative Percent |
|---|
| Female |
Valid |
Not Say |
92
| 1.9
| 1.9
| 1.9
|
|---|
| No |
596
| 12.2
| 12.2
| 14.1
|
|---|
| Yes |
3968
| 81.4
| 81.4
| 95.5
|
|---|
| Not Applicable |
219
| 4.5
| 4.5
| 100.0
|
|---|
| Total |
4875
| 100.0
| 100.0
|
|
|---|
| Male |
Valid |
Not Say |
136
| 1.8
| 1.8
| 1.8
|
|---|
| No |
950
| 12.3
| 12.3
| 14.1
|
|---|
| Yes |
6269
| 81.2
| 81.2
| 95.3
|
|---|
| Not Applicable |
361
| 4.7
| 4.7
| 100.0
|
|---|
| Total |
7716
| 100.0
| 100.0
|
|
|---|
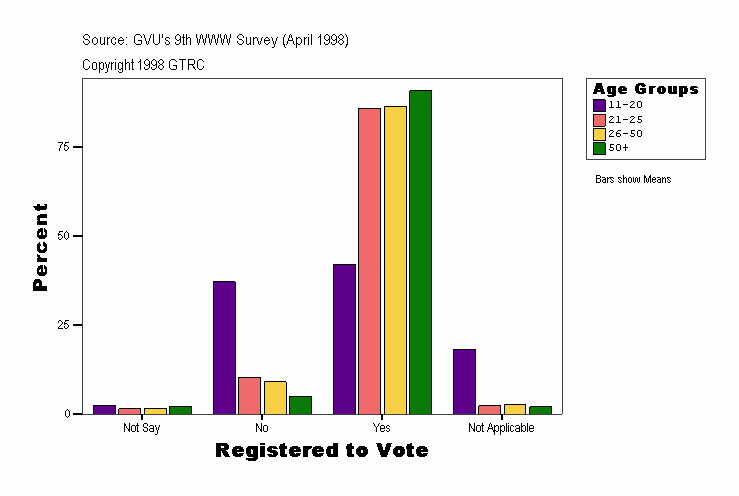
Registered to Vote
| Age Groups |
Frequency |
Percent |
Valid Percent |
Cumulative Percent |
|---|
| . |
Valid |
Not Say |
4
| 28.6
| 28.6
| 28.6
|
|---|
| No |
1
| 7.1
| 7.1
| 35.7
|
|---|
| Yes |
4
| 28.6
| 28.6
| 64.3
|
|---|
| Not Applicable |
5
| 35.7
| 35.7
| 100.0
|
|---|
| Total |
14
| 100.0
| 100.0
|
|
|---|
| 11-20 |
Valid |
Not Say |
41
| 2.5
| 2.5
| 2.5
|
|---|
| No |
605
| 37.2
| 37.2
| 39.7
|
|---|
| Yes |
685
| 42.1
| 42.1
| 81.8
|
|---|
| Not Applicable |
296
| 18.2
| 18.2
| 100.0
|
|---|
| Total |
1627
| 100.0
| 100.0
|
|
|---|
| 21-25 |
Valid |
Not Say |
27
| 1.4
| 1.4
| 1.4
|
|---|
| No |
198
| 10.4
| 10.4
| 11.8
|
|---|
| Yes |
1642
| 85.9
| 85.9
| 97.7
|
|---|
| Not Applicable |
44
| 2.3
| 2.3
| 100.0
|
|---|
| Total |
1911
| 100.0
| 100.0
|
|
|---|
| 26-50 |
Valid |
Not Say |
115
| 1.6
| 1.6
| 1.6
|
|---|
| No |
644
| 9.1
| 9.1
| 10.7
|
|---|
| Yes |
6139
| 86.6
| 86.6
| 97.3
|
|---|
| Not Applicable |
195
| 2.7
| 2.7
| 100.0
|
|---|
| Total |
7093
| 100.0
| 100.0
|
|
|---|
| 50+ |
Valid |
Not Say |
41
| 2.1
| 2.1
| 2.1
|
|---|
| No |
98
| 5.0
| 5.0
| 7.1
|
|---|
| Yes |
1767
| 90.8
| 90.8
| 97.9
|
|---|
| Not Applicable |
40
| 2.1
| 2.1
| 100.0
|
|---|
| Total |
1946
| 100.0
| 100.0
|
|
|---|
Registered to Vote
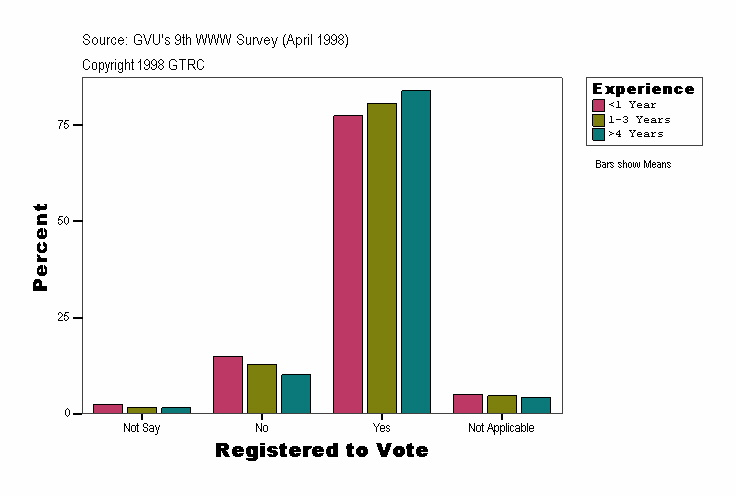
| Experience |
Frequency |
Percent |
Valid Percent |
Cumulative Percent |
|---|
| <1 Year |
Valid |
Not Say |
59
| 2.5
| 2.5
| 2.5
|
|---|
| No |
348
| 15.0
| 15.0
| 17.6
|
|---|
| Yes |
1796
| 77.4
| 77.4
| 95.0
|
|---|
| Not Applicable |
116
| 5.0
| 5.0
| 100.0
|
|---|
| Total |
2319
| 100.0
| 100.0
|
|
|---|
| 1-3 Years |
Valid |
Not Say |
96
| 1.7
| 1.7
| 1.7
|
|---|
| No |
730
| 12.9
| 12.9
| 14.6
|
|---|
| Yes |
4570
| 80.7
| 80.7
| 95.3
|
|---|
| Not Applicable |
265
| 4.7
| 4.7
| 100.0
|
|---|
| Total |
5661
| 100.0
| 100.0
|
|
|---|
| >4 Years |
Valid |
Not Say |
73
| 1.6
| 1.6
| 1.6
|
|---|
| No |
468
| 10.1
| 10.1
| 11.7
|
|---|
| Yes |
3871
| 84.0
| 84.0
| 95.7
|
|---|
| Not Applicable |
199
| 4.3
| 4.3
| 100.0
|
|---|
| Total |
4611
| 100.0
| 100.0
|
|
|---|
Source: GVU's Ninth WWW User Survey (Conducted April 1998)
URL:http://www.gvu.gatech.edu/user_surveys/
Copyright 1998 GTRC - ALL RIGHTS RESERVED
Contact: www-survey@cc.gatech.edu
For more information or to submit comments:
send email to www-survey@cc.gatech.edu.
GVU's WWW Surveying Team
Graphics, Visualization, & Usability Center
College of Computing
Georgia Institute of Technology
Atlanta, GA 30332-0280
