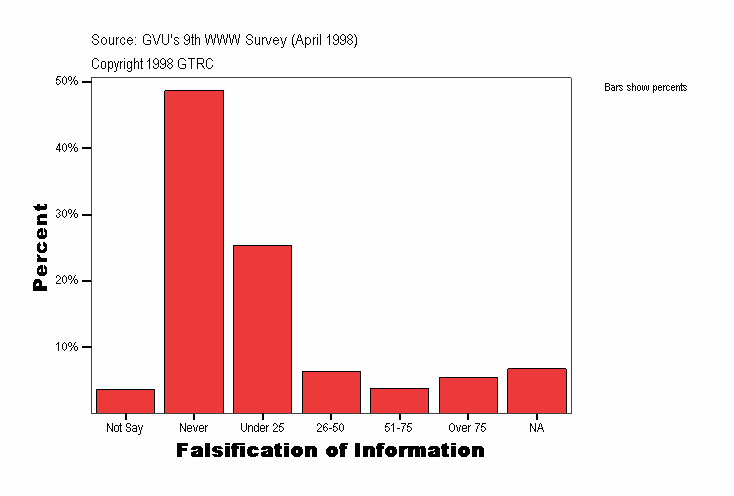
Falsification of Information
|
Frequency |
Percent |
Valid Percent |
Cumulative Percent |
|---|
| Valid |
Not Say |
457
| 3.6
| 3.6
| 3.6
|
|---|
| Never |
6125
| 48.6
| 48.6
| 52.3
|
|---|
| Under 25 |
3196
| 25.4
| 25.4
| 77.7
|
|---|
| 26-50 |
805
| 6.4
| 6.4
| 84.1
|
|---|
| 51-75 |
476
| 3.8
| 3.8
| 87.8
|
|---|
| Over 75 |
681
| 5.4
| 5.4
| 93.2
|
|---|
| NA |
851
| 6.8
| 6.8
| 100.0
|
|---|
| Total |
12591
| 100.0
| 100.0
|
|
|---|
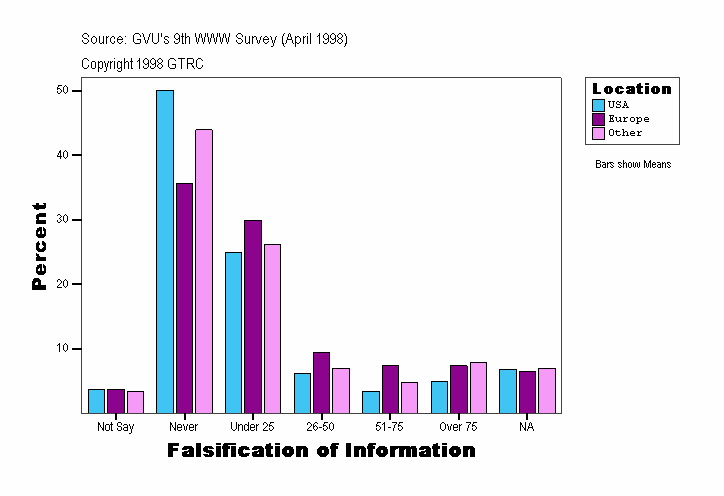
Falsification of Information
| Location |
Frequency |
Percent |
Valid Percent |
Cumulative Percent |
|---|
| USA |
Valid |
Not Say |
389
| 3.7
| 3.7
| 3.7
|
|---|
| Never |
5321
| 50.1
| 50.1
| 53.7
|
|---|
| Under 25 |
2654
| 25.0
| 25.0
| 78.7
|
|---|
| 26-50 |
650
| 6.1
| 6.1
| 84.8
|
|---|
| 51-75 |
362
| 3.4
| 3.4
| 88.3
|
|---|
| Over 75 |
530
| 5.0
| 5.0
| 93.2
|
|---|
| NA |
718
| 6.8
| 6.8
| 100.0
|
|---|
| Total |
10624
| 100.0
| 100.0
|
|
|---|
| Europe |
Valid |
Not Say |
27
| 3.7
| 3.7
| 3.7
|
|---|
| Never |
261
| 35.7
| 35.7
| 39.4
|
|---|
| Under 25 |
219
| 30.0
| 30.0
| 69.4
|
|---|
| 26-50 |
69
| 9.4
| 9.4
| 78.8
|
|---|
| 51-75 |
54
| 7.4
| 7.4
| 86.2
|
|---|
| Over 75 |
54
| 7.4
| 7.4
| 93.6
|
|---|
| NA |
47
| 6.4
| 6.4
| 100.0
|
|---|
| Total |
731
| 100.0
| 100.0
|
|
|---|
| Other |
Valid |
Not Say |
41
| 3.3
| 3.3
| 3.3
|
|---|
| Never |
543
| 43.9
| 43.9
| 47.2
|
|---|
| Under 25 |
323
| 26.1
| 26.1
| 73.4
|
|---|
| 26-50 |
86
| 7.0
| 7.0
| 80.3
|
|---|
| 51-75 |
60
| 4.9
| 4.9
| 85.2
|
|---|
| Over 75 |
97
| 7.8
| 7.8
| 93.0
|
|---|
| NA |
86
| 7.0
| 7.0
| 100.0
|
|---|
| Total |
1236
| 100.0
| 100.0
|
|
|---|
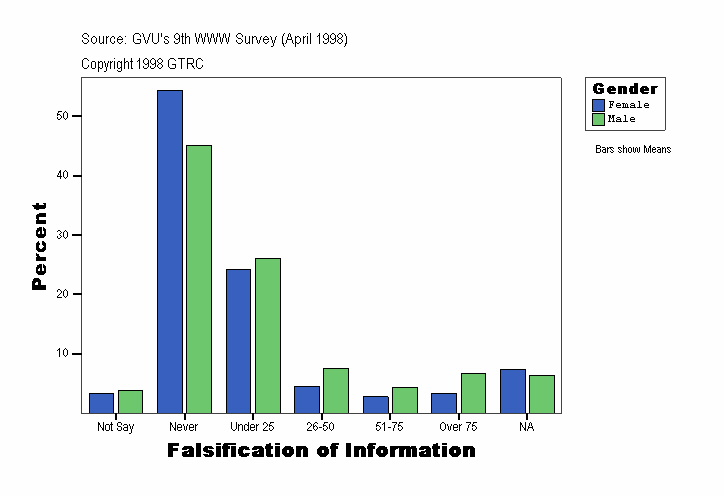
Falsification of Information
| Gender |
Frequency |
Percent |
Valid Percent |
Cumulative Percent |
|---|
| Female |
Valid |
Not Say |
159
| 3.3
| 3.3
| 3.3
|
|---|
| Never |
2650
| 54.4
| 54.4
| 57.6
|
|---|
| Under 25 |
1180
| 24.2
| 24.2
| 81.8
|
|---|
| 26-50 |
224
| 4.6
| 4.6
| 86.4
|
|---|
| 51-75 |
135
| 2.8
| 2.8
| 89.2
|
|---|
| Over 75 |
165
| 3.4
| 3.4
| 92.6
|
|---|
| NA |
362
| 7.4
| 7.4
| 100.0
|
|---|
| Total |
4875
| 100.0
| 100.0
|
|
|---|
| Male |
Valid |
Not Say |
298
| 3.9
| 3.9
| 3.9
|
|---|
| Never |
3475
| 45.0
| 45.0
| 48.9
|
|---|
| Under 25 |
2016
| 26.1
| 26.1
| 75.0
|
|---|
| 26-50 |
581
| 7.5
| 7.5
| 82.6
|
|---|
| 51-75 |
341
| 4.4
| 4.4
| 87.0
|
|---|
| Over 75 |
516
| 6.7
| 6.7
| 93.7
|
|---|
| NA |
489
| 6.3
| 6.3
| 100.0
|
|---|
| Total |
7716
| 100.0
| 100.0
|
|
|---|
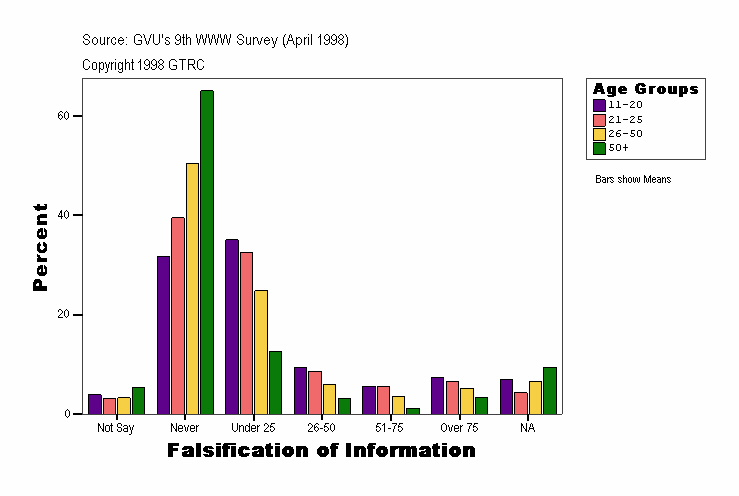
Falsification of Information
| Age Groups |
Frequency |
Percent |
Valid Percent |
Cumulative Percent |
|---|
| . |
Valid |
Not Say |
2
| 14.3
| 14.3
| 14.3
|
|---|
| Never |
5
| 35.7
| 35.7
| 50.0
|
|---|
| 26-50 |
1
| 7.1
| 7.1
| 57.1
|
|---|
| Over 75 |
2
| 14.3
| 14.3
| 71.4
|
|---|
| NA |
4
| 28.6
| 28.6
| 100.0
|
|---|
| Total |
14
| 100.0
| 100.0
|
|
|---|
| 11-20 |
Valid |
Not Say |
63
| 3.9
| 3.9
| 3.9
|
|---|
| Never |
515
| 31.7
| 31.7
| 35.5
|
|---|
| Under 25 |
571
| 35.1
| 35.1
| 70.6
|
|---|
| 26-50 |
152
| 9.3
| 9.3
| 80.0
|
|---|
| 51-75 |
91
| 5.6
| 5.6
| 85.6
|
|---|
| Over 75 |
121
| 7.4
| 7.4
| 93.0
|
|---|
| NA |
114
| 7.0
| 7.0
| 100.0
|
|---|
| Total |
1627
| 100.0
| 100.0
|
|
|---|
| 21-25 |
Valid |
Not Say |
59
| 3.1
| 3.1
| 3.1
|
|---|
| Never |
755
| 39.5
| 39.5
| 42.6
|
|---|
| Under 25 |
620
| 32.4
| 32.4
| 75.0
|
|---|
| 26-50 |
164
| 8.6
| 8.6
| 83.6
|
|---|
| 51-75 |
107
| 5.6
| 5.6
| 89.2
|
|---|
| Over 75 |
124
| 6.5
| 6.5
| 95.7
|
|---|
| NA |
82
| 4.3
| 4.3
| 100.0
|
|---|
| Total |
1911
| 100.0
| 100.0
|
|
|---|
| 26-50 |
Valid |
Not Say |
230
| 3.2
| 3.2
| 3.2
|
|---|
| Never |
3584
| 50.5
| 50.5
| 53.8
|
|---|
| Under 25 |
1760
| 24.8
| 24.8
| 78.6
|
|---|
| 26-50 |
426
| 6.0
| 6.0
| 84.6
|
|---|
| 51-75 |
256
| 3.6
| 3.6
| 88.2
|
|---|
| Over 75 |
369
| 5.2
| 5.2
| 93.4
|
|---|
| NA |
468
| 6.6
| 6.6
| 100.0
|
|---|
| Total |
7093
| 100.0
| 100.0
|
|
|---|
| 50+ |
Valid |
Not Say |
103
| 5.3
| 5.3
| 5.3
|
|---|
| Never |
1266
| 65.1
| 65.1
| 70.3
|
|---|
| Under 25 |
245
| 12.6
| 12.6
| 82.9
|
|---|
| 26-50 |
62
| 3.2
| 3.2
| 86.1
|
|---|
| 51-75 |
22
| 1.1
| 1.1
| 87.3
|
|---|
| Over 75 |
65
| 3.3
| 3.3
| 90.6
|
|---|
| NA |
183
| 9.4
| 9.4
| 100.0
|
|---|
| Total |
1946
| 100.0
| 100.0
|
|
|---|
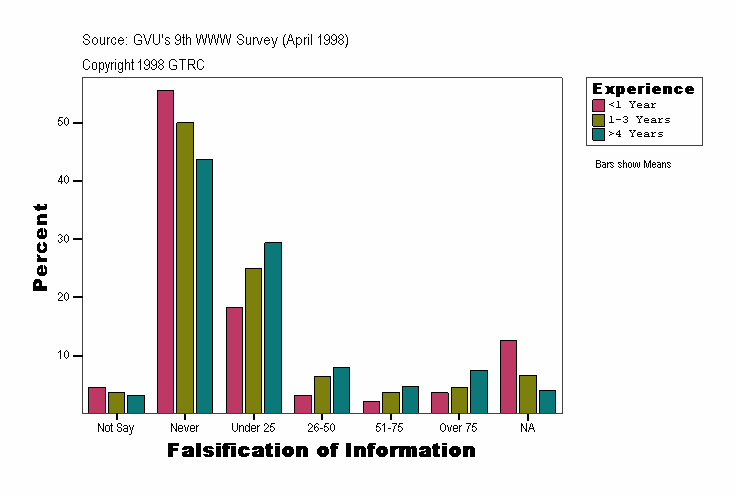
Falsification of Information
| Experience |
Frequency |
Percent |
Valid Percent |
Cumulative Percent |
|---|
| <1 Year |
Valid |
Not Say |
105
| 4.5
| 4.5
| 4.5
|
|---|
| Never |
1286
| 55.5
| 55.5
| 60.0
|
|---|
| Under 25 |
425
| 18.3
| 18.3
| 78.3
|
|---|
| 26-50 |
74
| 3.2
| 3.2
| 81.5
|
|---|
| 51-75 |
51
| 2.2
| 2.2
| 83.7
|
|---|
| Over 75 |
84
| 3.6
| 3.6
| 87.3
|
|---|
| NA |
294
| 12.7
| 12.7
| 100.0
|
|---|
| Total |
2319
| 100.0
| 100.0
|
|
|---|
| 1-3 Years |
Valid |
Not Say |
208
| 3.7
| 3.7
| 3.7
|
|---|
| Never |
2829
| 50.0
| 50.0
| 53.6
|
|---|
| Under 25 |
1416
| 25.0
| 25.0
| 78.7
|
|---|
| 26-50 |
367
| 6.5
| 6.5
| 85.1
|
|---|
| 51-75 |
212
| 3.7
| 3.7
| 88.9
|
|---|
| Over 75 |
253
| 4.5
| 4.5
| 93.4
|
|---|
| NA |
376
| 6.6
| 6.6
| 100.0
|
|---|
| Total |
5661
| 100.0
| 100.0
|
|
|---|
| >4 Years |
Valid |
Not Say |
144
| 3.1
| 3.1
| 3.1
|
|---|
| Never |
2010
| 43.6
| 43.6
| 46.7
|
|---|
| Under 25 |
1355
| 29.4
| 29.4
| 76.1
|
|---|
| 26-50 |
364
| 7.9
| 7.9
| 84.0
|
|---|
| 51-75 |
213
| 4.6
| 4.6
| 88.6
|
|---|
| Over 75 |
344
| 7.5
| 7.5
| 96.1
|
|---|
| NA |
181
| 3.9
| 3.9
| 100.0
|
|---|
| Total |
4611
| 100.0
| 100.0
|
|
|---|
Source: GVU's Ninth WWW User Survey (Conducted April 1998)
URL:http://www.gvu.gatech.edu/user_surveys/
Copyright 1998 GTRC - ALL RIGHTS RESERVED
Contact: www-survey@cc.gatech.edu
For more information or to submit comments:
send email to www-survey@cc.gatech.edu.
GVU's WWW Surveying Team
Graphics, Visualization, & Usability Center
College of Computing
Georgia Institute of Technology
Atlanta, GA 30332-0280
