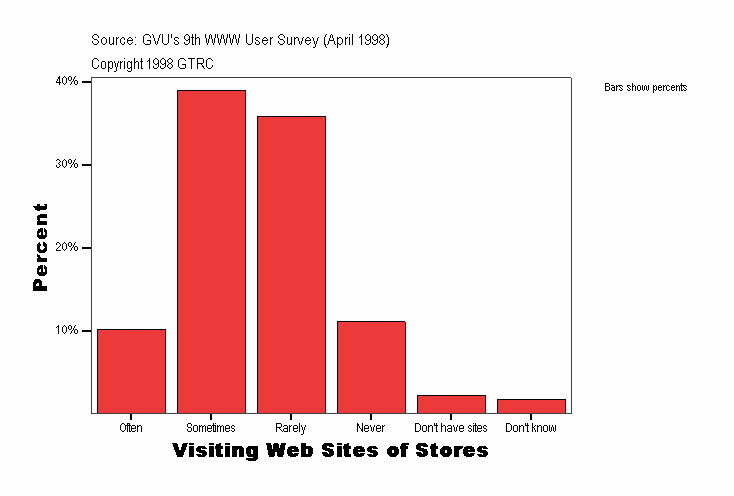
Visiting Web Sites of Stores
|
Frequency |
Percent |
Valid Percent |
Cumulative Percent |
|---|
| Valid |
Often |
23
| 10.2
| 10.2
| 10.2
|
|---|
| Sometimes |
88
| 38.9
| 38.9
| 49.1
|
|---|
| Rarely |
81
| 35.8
| 35.8
| 85.0
|
|---|
| Never |
25
| 11.1
| 11.1
| 96.0
|
|---|
| Don't have sites |
5
| 2.2
| 2.2
| 98.2
|
|---|
| Don't know |
4
| 1.8
| 1.8
| 100.0
|
|---|
| Total |
226
| 100.0
| 100.0
|
|
|---|
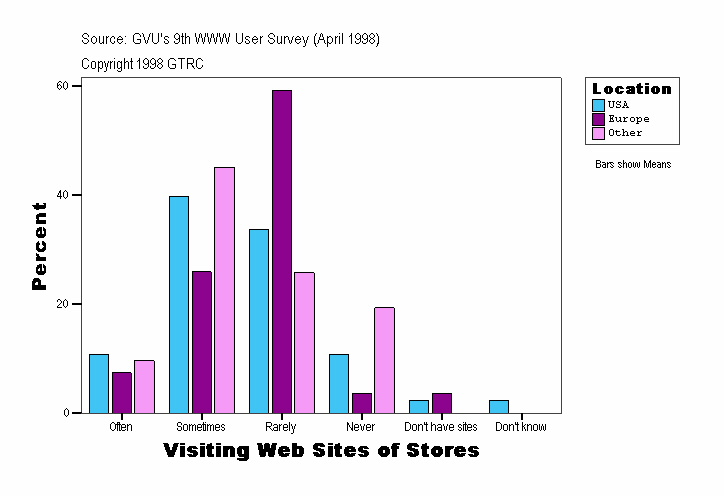
Visiting Web Sites of Stores
| Location |
Frequency |
Percent |
Valid Percent |
Cumulative Percent |
|---|
| . |
Valid |
Sometimes |
1
| 50.0
| 50.0
| 50.0
|
|---|
| Rarely |
1
| 50.0
| 50.0
| 100.0
|
|---|
| Total |
2
| 100.0
| 100.0
|
|
|---|
| USA |
Valid |
Often |
18
| 10.8
| 10.8
| 10.8
|
|---|
| Sometimes |
66
| 39.8
| 39.8
| 50.6
|
|---|
| Rarely |
56
| 33.7
| 33.7
| 84.3
|
|---|
| Never |
18
| 10.8
| 10.8
| 95.2
|
|---|
| Don't have sites |
4
| 2.4
| 2.4
| 97.6
|
|---|
| Don't know |
4
| 2.4
| 2.4
| 100.0
|
|---|
| Total |
166
| 100.0
| 100.0
|
|
|---|
| Europe |
Valid |
Often |
2
| 7.4
| 7.4
| 7.4
|
|---|
| Sometimes |
7
| 25.9
| 25.9
| 33.3
|
|---|
| Rarely |
16
| 59.3
| 59.3
| 92.6
|
|---|
| Never |
1
| 3.7
| 3.7
| 96.3
|
|---|
| Don't have sites |
1
| 3.7
| 3.7
| 100.0
|
|---|
| Total |
27
| 100.0
| 100.0
|
|
|---|
| Other |
Valid |
Often |
3
| 9.7
| 9.7
| 9.7
|
|---|
| Sometimes |
14
| 45.2
| 45.2
| 54.8
|
|---|
| Rarely |
8
| 25.8
| 25.8
| 80.6
|
|---|
| Never |
6
| 19.4
| 19.4
| 100.0
|
|---|
| Total |
31
| 100.0
| 100.0
|
|
|---|
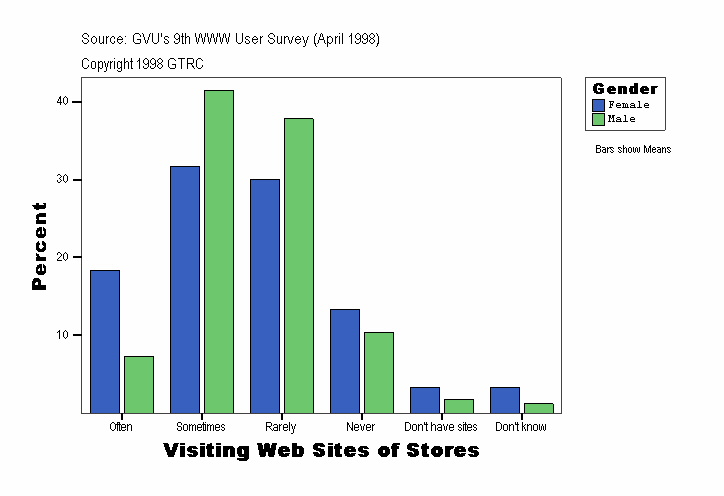
Visiting Web Sites of Stores
| Gender |
Frequency |
Percent |
Valid Percent |
Cumulative Percent |
|---|
| . |
Valid |
Sometimes |
1
| 50.0
| 50.0
| 50.0
|
|---|
| Rarely |
1
| 50.0
| 50.0
| 100.0
|
|---|
| Total |
2
| 100.0
| 100.0
|
|
|---|
| Female |
Valid |
Often |
11
| 18.3
| 18.3
| 18.3
|
|---|
| Sometimes |
19
| 31.7
| 31.7
| 50.0
|
|---|
| Rarely |
18
| 30.0
| 30.0
| 80.0
|
|---|
| Never |
8
| 13.3
| 13.3
| 93.3
|
|---|
| Don't have sites |
2
| 3.3
| 3.3
| 96.7
|
|---|
| Don't know |
2
| 3.3
| 3.3
| 100.0
|
|---|
| Total |
60
| 100.0
| 100.0
|
|
|---|
| Male |
Valid |
Often |
12
| 7.3
| 7.3
| 7.3
|
|---|
| Sometimes |
68
| 41.5
| 41.5
| 48.8
|
|---|
| Rarely |
62
| 37.8
| 37.8
| 86.6
|
|---|
| Never |
17
| 10.4
| 10.4
| 97.0
|
|---|
| Don't have sites |
3
| 1.8
| 1.8
| 98.8
|
|---|
| Don't know |
2
| 1.2
| 1.2
| 100.0
|
|---|
| Total |
164
| 100.0
| 100.0
|
|
|---|
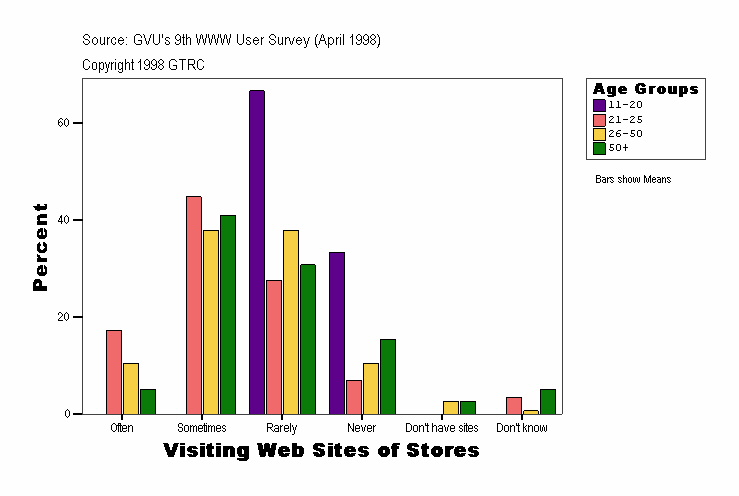
Visiting Web Sites of Stores
| Age Groups |
Frequency |
Percent |
Valid Percent |
Cumulative Percent |
|---|
| . |
Valid |
Sometimes |
1
| 50.0
| 50.0
| 50.0
|
|---|
| Rarely |
1
| 50.0
| 50.0
| 100.0
|
|---|
| Total |
2
| 100.0
| 100.0
|
|
|---|
| 11-20 |
Valid |
Rarely |
2
| 66.7
| 66.7
| 66.7
|
|---|
| Never |
1
| 33.3
| 33.3
| 100.0
|
|---|
| Total |
3
| 100.0
| 100.0
|
|
|---|
| 21-25 |
Valid |
Often |
5
| 17.2
| 17.2
| 17.2
|
|---|
| Sometimes |
13
| 44.8
| 44.8
| 62.1
|
|---|
| Rarely |
8
| 27.6
| 27.6
| 89.7
|
|---|
| Never |
2
| 6.9
| 6.9
| 96.6
|
|---|
| Don't know |
1
| 3.4
| 3.4
| 100.0
|
|---|
| Total |
29
| 100.0
| 100.0
|
|
|---|
| 26-50 |
Valid |
Often |
16
| 10.5
| 10.5
| 10.5
|
|---|
| Sometimes |
58
| 37.9
| 37.9
| 48.4
|
|---|
| Rarely |
58
| 37.9
| 37.9
| 86.3
|
|---|
| Never |
16
| 10.5
| 10.5
| 96.7
|
|---|
| Don't have sites |
4
| 2.6
| 2.6
| 99.3
|
|---|
| Don't know |
1
| .7
| .7
| 100.0
|
|---|
| Total |
153
| 100.0
| 100.0
|
|
|---|
| 50+ |
Valid |
Often |
2
| 5.1
| 5.1
| 5.1
|
|---|
| Sometimes |
16
| 41.0
| 41.0
| 46.2
|
|---|
| Rarely |
12
| 30.8
| 30.8
| 76.9
|
|---|
| Never |
6
| 15.4
| 15.4
| 92.3
|
|---|
| Don't have sites |
1
| 2.6
| 2.6
| 94.9
|
|---|
| Don't know |
2
| 5.1
| 5.1
| 100.0
|
|---|
| Total |
39
| 100.0
| 100.0
|
|
|---|
Visiting Web Sites of Stores
| Experience |
Frequency |
Percent |
Valid Percent |
Cumulative Percent |
|---|
| . |
Valid |
Sometimes |
1
| 50.0
| 50.0
| 50.0
|
|---|
| Rarely |
1
| 50.0
| 50.0
| 100.0
|
|---|
| Total |
2
| 100.0
| 100.0
|
|
|---|
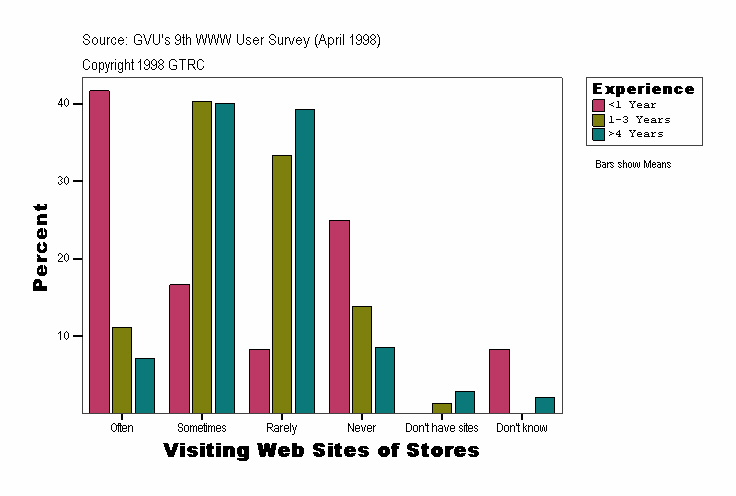
| <1 Year |
Valid |
Often |
5
| 41.7
| 41.7
| 41.7
|
|---|
| Sometimes |
2
| 16.7
| 16.7
| 58.3
|
|---|
| Rarely |
1
| 8.3
| 8.3
| 66.7
|
|---|
| Never |
3
| 25.0
| 25.0
| 91.7
|
|---|
| Don't know |
1
| 8.3
| 8.3
| 100.0
|
|---|
| Total |
12
| 100.0
| 100.0
|
|
|---|
| 1-3 Years |
Valid |
Often |
8
| 11.1
| 11.1
| 11.1
|
|---|
| Sometimes |
29
| 40.3
| 40.3
| 51.4
|
|---|
| Rarely |
24
| 33.3
| 33.3
| 84.7
|
|---|
| Never |
10
| 13.9
| 13.9
| 98.6
|
|---|
| Don't have sites |
1
| 1.4
| 1.4
| 100.0
|
|---|
| Total |
72
| 100.0
| 100.0
|
|
|---|
| >4 Years |
Valid |
Often |
10
| 7.1
| 7.1
| 7.1
|
|---|
| Sometimes |
56
| 40.0
| 40.0
| 47.1
|
|---|
| Rarely |
55
| 39.3
| 39.3
| 86.4
|
|---|
| Never |
12
| 8.6
| 8.6
| 95.0
|
|---|
| Don't have sites |
4
| 2.9
| 2.9
| 97.9
|
|---|
| Don't know |
3
| 2.1
| 2.1
| 100.0
|
|---|
| Total |
140
| 100.0
| 100.0
|
|
|---|
Source: GVU's Ninth WWW User Survey (Conducted April 1998)
URL:http://www.gvu.gatech.edu/user_surveys/
Copyright 1998 GTRC - ALL RIGHTS RESERVED
Contact: www-survey@cc.gatech.edu
For more information or to submit comments:
send email to www-survey@cc.gatech.edu.
GVU's WWW Surveying Team
Graphics, Visualization, & Usability Center
College of Computing
Georgia Institute of Technology
Atlanta, GA 30332-0280
