
[ Survey Home ]
[ 9th Survey Home ]
[ Graphs ]
[ Reports ]
[ Datasets ]
GVU's 9th WWW User Survey
Web and Internet Use Summary
Note: Some of these questions actually appeared in the General Demographics questionnaire, rather than the Web and Internet Use questionnaire.
Hours of Web Use
Because of our methodology of attracting survey respondents by advertising on other web sites, we tend to get respondents who spend a substantial of time using the web. In other words, the more time you spend online, the more likely you are to find out about our survey. For this reason, our results show a bias toward more active web users with the largest category spending 10-20 hours using the web each week (32.7%). 26.4% of respondents use it for more hours while 40.9% use it for fewer hours. Respondents who have been online for more years tend to spend more hours using the web, but statistically the relationship is still fairly weak.
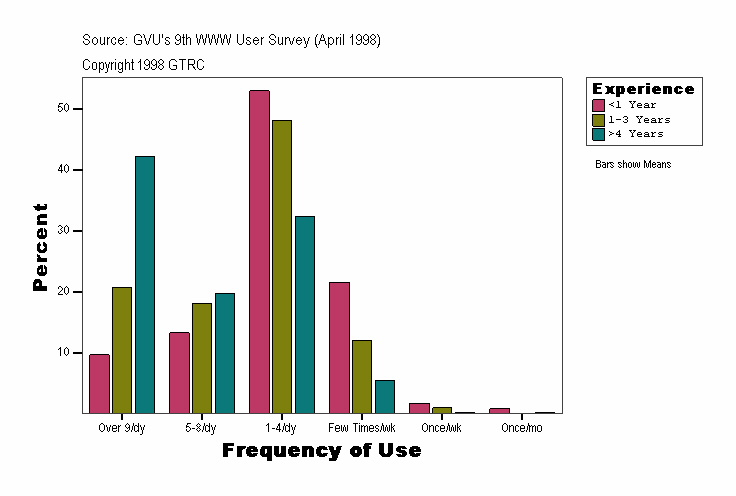
Frequency of Web Use
Not only do respondents spend a lot of hours on the web, but they do so in multiple sessions with the majority of respondents accessing the web daily (87.9% Ninth, 85.37% Eighth, 85.16% Seventh). Males are more likely to be very frequent users than females. Frequency of access also increase with years spent on the internet, but even for the newest users the largest category accesses the web 1 to 4 times a day ( 52.9%).
Indispensable Technologies
The question of which technologies people find "Indispensable" was first raised in the Eighth survey. At the time, we were surprised to learn that such a high percentage of respondents found the web to be indispensable and nearly as many found email to be also. For the Ninth survey, those percentages have risen even higher and email rose 9 percentage points to become the most indispensable technology among those we listed. Having nearly as big an increase was Java/JavaScript with an increase of 8.1 percentage points. (Although Java and JavaScript are quite different from a technical perspective, we believe most respondents would not distinguish between the two.) Java/JavaScript also showed an increase in the number of people who have used this technology (See the Technology Summary). Audio is another technology that showed a higher than average increase in indispensability (+3.8%).
|
GVU9 |
GVU8 |
% Change |
|
|
|
93.3 |
84.3 |
+9 |
|
WWW |
90.6 |
88.7 |
+1.9 |
|
Java/JavaScript |
29.7 |
21.6 |
+8.1 |
|
Chat |
23.9 |
22.3 |
+1.6 |
|
Audio |
20.9 |
17.1 |
+3.8 |
|
Video |
7.9 |
6 |
+1.9 |
|
Digital signatures |
7.1 |
5.2 |
+1.9 |
|
Internet Phone |
6.5 |
4.7 |
+1.8 |
|
Internet Fax |
6.1 |
4.3 |
+1.8 |
|
3-D |
5.8 |
4.5 |
+1.3 |
|
Push |
5.3 |
4.5 |
+0.8 |
Table 1 - Changes in "Indispensable" Technologies
Community Building
45% of respondents reported that after coming online they have become more connected to people like themselves. This figure is virtually unchanged over the last 3 surveys. Only 2.7% reported feeling less connected. Younger respondents (ages 11-20) are most likely to feel connected to others (50.8% feel more connected). More experienced users (over 4 years online) are most likely to feel connected (51.7% feel more connected) while newer users are unsure (38% aren't sure if they feel more connected or not). This suggests that more experienced users might have had more opportunity to meet people online, build longer relationships (often professional ones), and also might be more adept at using the technology needed to communicate with other people.
Community Membership
Respondents could choose more than one answer to this question. Respondents report feeling more connected with people who share their hobbies (44.4%) and professions (32.7%) after coming online. 29.7% also report feeling more closely connected with their families. More males than females report feeling connected with professional and political groups; the reverse is true for religious and support groups as well as families. Younger respondents connect more through their hobbies and religious groups while older respondents connect to professional or family groups. Respondents online for longer periods of time report being connected with more groups than newer users. For all categories, those online for more than 4 years reported feeling more connected.
Falsification of Information
As in previous surveys, the largest category of respondents indicated that they never provide false information when registering with a web site (48.6%). This means, however, that more than half of respondents do report false information, at least occasionally (25.4% do about a quarter of the time). Only 5.4% routinely provide false information (i.e. 75% of the time or more). 54% of females reported that they never falsify information, compared with 45% of males. Other survey questions indicate that females guard their privacy more closely than males, so females may register with fewer sites instead of supplying false information. The likelihood of supplying false information to web sites decreases with age -- again this might be explained by older respondents being less likely to register with a site at all, but we cannot confirm this with our survey.
Opinions on Censorship
Respondents are quite strongly divided as to whether some information should not be published on the Internet: 44.9% agree (or agree strongly) and 45.4% disagree (or disagree strongly). Most of those who disagree, disagree strongly (29.2% of total responses). More US respondents agree strongly (23.7%) than respondents from Europe (15.6%), but about the same percentage agree or agree strongly. Far more males than females disagree strongly with the idea that some information should not be on the Internet: 18.9% of females and 35.7% of males. Respondents over 50 are more likely to agree or agree strongly with the idea (51.2%) than other age groups. New users are also more likely to agree than more experienced users.
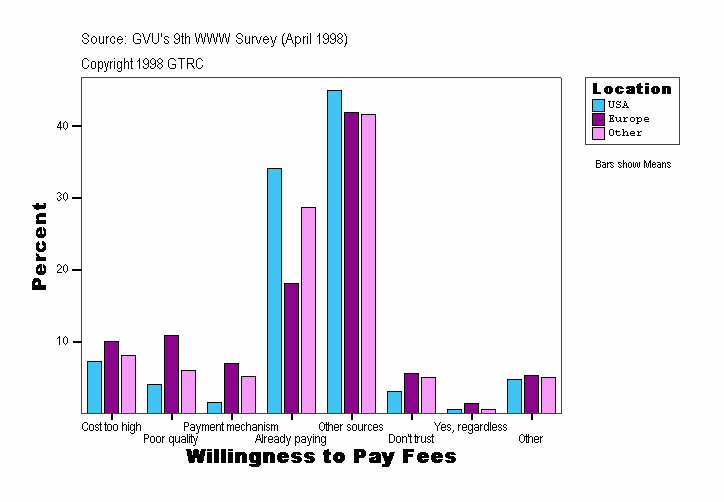
Willingness to Pay Fees
The main reason that respondents are not willing to pay to access a web site is that they feel that the information is available for free from other sources (44.5%). For sites wishing to charge for access, unique content is probably a key component (and making the uniqueness clear to users is important as well). Also, almost a third of respondents didn't like paying for access because they are already paying to connect to the internet (32.7%). For our survey, more than 2/3 of respondents pay for their own access, at least in part. In general, it seems that convenience is not a compelling reason for people to pay to access web sites. Those groups most likely to be paying for their own access (US respondents, those over age 50) don't want to pay an additional amount for individual sites. Those whose access is subsidized or completely paid for by others are somewhat more concerned about cost, quality of information, and payment mechanisms.
Navigation Services
Respondents could choose more than one answer to this question. Navigation services, which include things like search engines (like AltaVista), web indices (like Yahoo), and people-finding services (like 411), are important tools for finding things on the web. They are also prime places for advertisers to put banners and are one of the most successful examples of advertiser-supported services on the web. Recently, many of these sites have been expanding their services and building affiliations with content providers, online merchants, and more. In addition to performing regular searches, users can also get the latest headlines, check on sports scores, translate a page to other languages, look at stock prices, chat with friends or celebrities, get today's horoscope, apply for a Visa Card, see if they have won the lottery, track their UPS packages, download free software�the list goes on. Sites like these are no longer just search engines, but are called "portal sites", as in your "door or entrance" to the internet. Many sites offer personalization of the content and free email accounts as well. An important question for future surveys will be to find out how loyal users are to a particular site. The portal site actually embodies one of the original concepts that Tim Berners-Lee had for the web: the "home" page, not as a business card for the rest of the world, but rather as the place that your browser started from everyday.|
GVU9 |
GVU8 |
% Change |
|
|
Yahoo |
93.4* |
84.1* |
+9.3 |
|
Alta Vista |
81.4 |
67.3 |
+14.1 |
|
InfoSeek |
70.2 |
60.3 |
+9.9 |
|
Excite |
69.9 |
66.1 |
+3.8 |
|
Lycos |
68.2 |
58.5 |
+9.7 |
|
HotBot |
46.2 |
34.3 |
+11.9 |
|
Web Crawler |
45.6 |
46.1 |
-0.5 |
|
411 |
32.9 |
37.4 |
-4.5 |
|
Bigfoot |
25.2 |
22.2 |
+3 |
|
WhoWhere |
24.8 |
23.1 |
+1.7 |
|
AOL NetFind |
20.8 |
12.3 |
+8.5 |
|
Other |
17.5 |
17.7 |
-0.2 |
|
MetaCrawler |
15.1 |
N/A |
N/A |
|
GTE SuperPages |
10.4 |
8.9 |
+1.5 |
|
Don't Know |
0.7 |
1.5 |
-0.8 |
|
* Note that this survey was advertised on Yahoo which may inflate this figure. |
|||
Table 2 - Changes in Use of Navigation Services
Web Ordering
Just over 3/4 of respondents (76.2%) reported that they have "ordered a product/service by filling out a form on the web". Respondents from the US, males, and experienced Internet users are more likely to have done this than other categories of users. This figure is higher than in the previous survey where 68.1% of respondents had placed an order over the web. Note that this question does not specifically making purchases (i.e. giving out credit card information) over the web. Still, this figure is surprisingly high and we are currently looking into different explanations of this result.
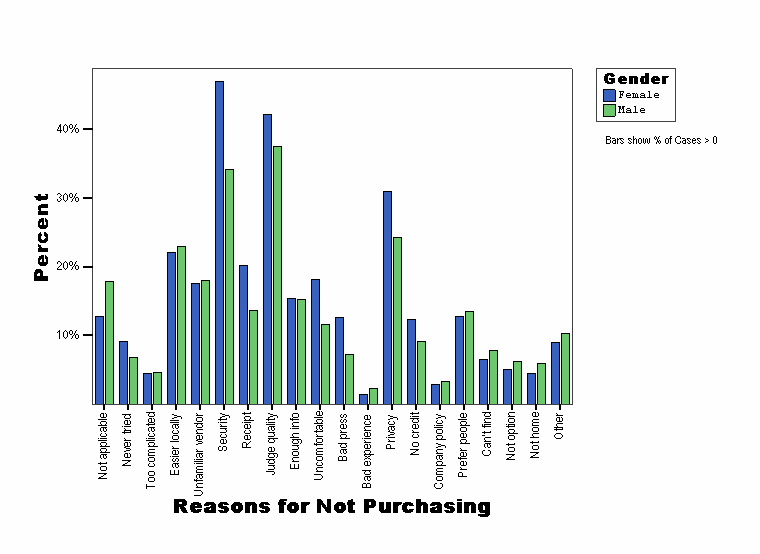
Reasons for Not Purchasing over the Web
Respondents could choose more than one answer to this question. The two most commonly cited reasons for not making purchases over the web are: not trusting that my credit card number will be secure (39.1%) and not being able to judge the quality of the product (39.3%). This is followed by not trusting that personal information will be kept private (26.9%) and finding it faster/easier to shop locally (22.6%). Interestingly, 9.3% of respondents don't make purchases because they've heard that it is not a reliable/trustworthy/secure but only 1.9% have actually had a bad experience with web purchasing. In fact, having a bad experience was the least cited reason for not making more purchases on the web. Only 4.5% of respondents found the process to be (or think the process will be) too complicated. This is probably a reflection of the self-selected nature of our survey -- users who find web purchasing to be too complicated may also find filling out our survey to be too complicated. As the chart below shows, the number one concern for males was judging the quality of products while the number one reason for females is credit card security. These are the top two concerns for both groups, however.
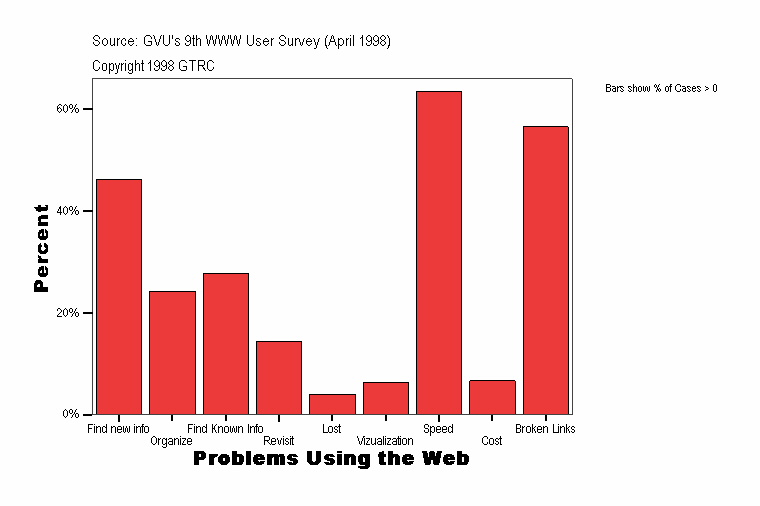
Problems Using the Web
Across all groups of users, taking too long to download pages (i.e. "speed") is the most commonly experienced problem with the web (64.8% of respondents). The percentage reporting this problem has been consistent over the last two surveys (63% in the Eighth and 66% in the Seventh). Even though modem speeds continue to rise and respondents upgrade their modems fairly frequently (48% have upgraded in the past year), web pages become even more heavily laden with images, animations, scripts, programs, etc. all of which take extra time to download. Online retailers especially should take note: 53% of respondents reported that they had left a web site while searching for product information simply because the site was too slow. The next most frequently cited problem on the web is a growing one--broken links. Although solutions for dealing with broken links are well-known to web designers (i.e. automated auditing of external links for validity, redirecting bad URLs to a search page, etc.) most sites don't seem to employ these techniques. As anyone who has spent any time on the web can tell you, the problem certainly seems to be getting worse.
Other Questions Asked but Not Presented in this Summary
How many hours per week do you use your computer for fun/play?
How many hours per week do you use your computer for work?
How many hours per week do you use your computer for personal reasons?
What do you primarily use the Web for?
How do you find out about new WWW pages/sites?
Approximately how many items does your Favorites/Bookmarks contain?
Why do you save/print WWW documents that you view?
What problems do you have using your favorites/bookmarks utility?
Please indicate which of the following Favorite/Bookmark activities you perform.
How often do you browse with images/pictures turned off (image loading/show pictures option)?
Which of the following cookie policies do you primarily use when browsing?
The Web is a versatile tool. Please indicate how often you have used the Web for each of the following categories during the past 6 months.
to access newsgroups?
to access online newspapers?
to access information about commercial products/services?
instead of watching TV?
to access reference materials?
to access research reports & projects?
to access financial information?
to access health/medical information?
to access online chat groups?
to access online job listings?
to access online home/rental listings?
to access online telephone listings?
to access online maps?
to search for product/service information or make purchases?
[ Survey Home ] [ 9th Survey Home ] [ Graphs ] [ Reports ] [ Datasets ]
Georgia Tech Research Corporation Atlanta, Georgia 30332-0415 ALL RIGHTS RESERVED Usage Restrictions |
send e-mail to www-survey@cc.gatech.edu.
GVU's WWW Surveying Team |